
Major League Soccer – Defending Efficiency Index – Who’s best, worst and most effective in the Final Third across all MLS?
Yesterday I posted my initial article on an MLS Attacking Efficiency Index rating along with some other data points on the best and worst across MLS in the final third.
Tonight I will offer the same from a Defending standpoint plus a bit more grist on the attacking side.
So you know going in – in all the larger bar chart diagrams the teams ‘currently’ in the top five for both conferences have green bars while those sucking up the rear have red bars.
In addition, where I’ve plotted the PWP data points now in use I have offered up two different curv-e-linear relationships; one looking at an Exponential Regression and one looking at a Polynomial Regression. This won’t matter too much to those not familiar with statistics but for most the one with the greater (R2) is the one that will statistically have more relevance to the overall data point array.
Finally; I’m not foolish enough to think that statistics ‘are’ the know-all, end-all in this game but they do have relevance. The balance between ‘thinking and feeling’ in this game is difficult at the best of times – but like in most management decision making environments, statistics have their place.
On to the grist…
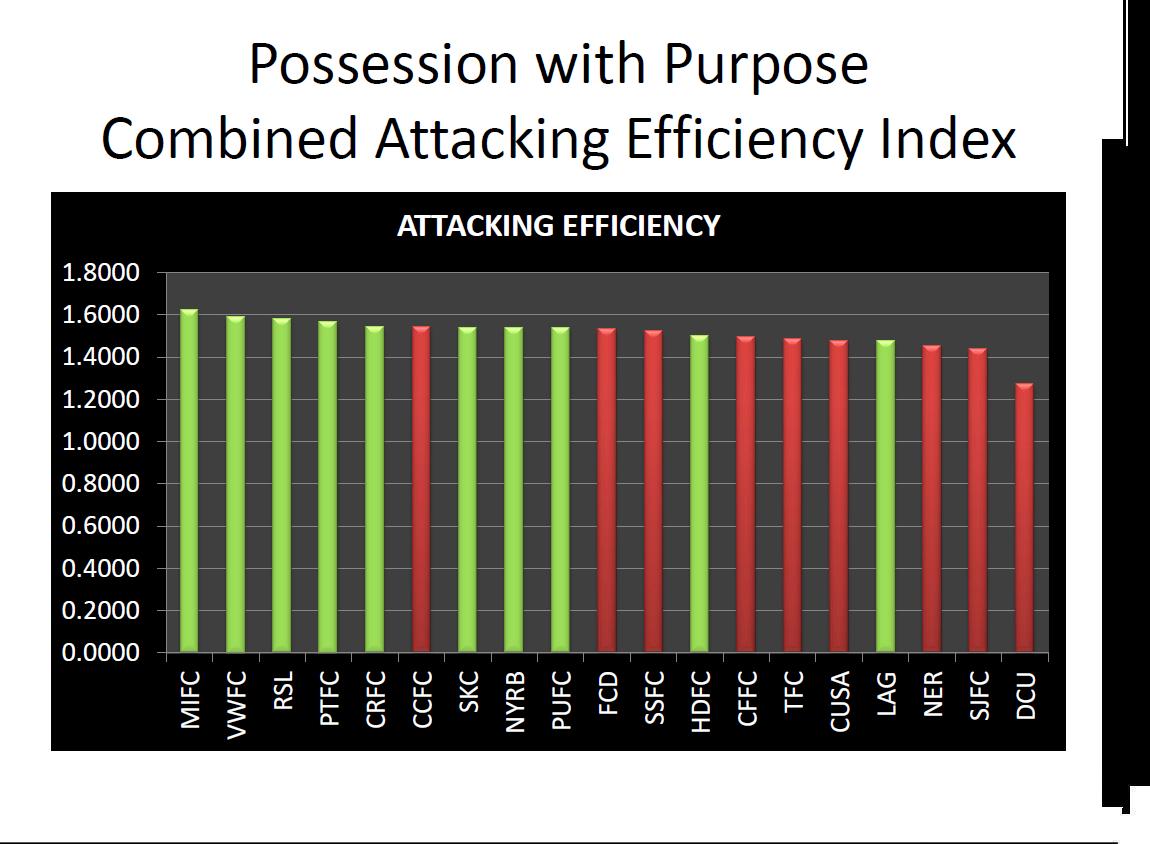
PWP COMBINED ATTACKING EFFICIENCY INDEX FOR ALL OF MLS
A reminder of the combined Attacking Efficiency Index, to date, for all teams in MLS…
Green bars represent current teams in the playoff pool; as noted yesterday the primary reason why LA Galaxy are so low in this Index is due to the overwhelmingly large number of passing activities compared to other MLS teams.
Next up; the PWP relationship diagrams – first up the Exponential Regression – note the R2 = .9337.
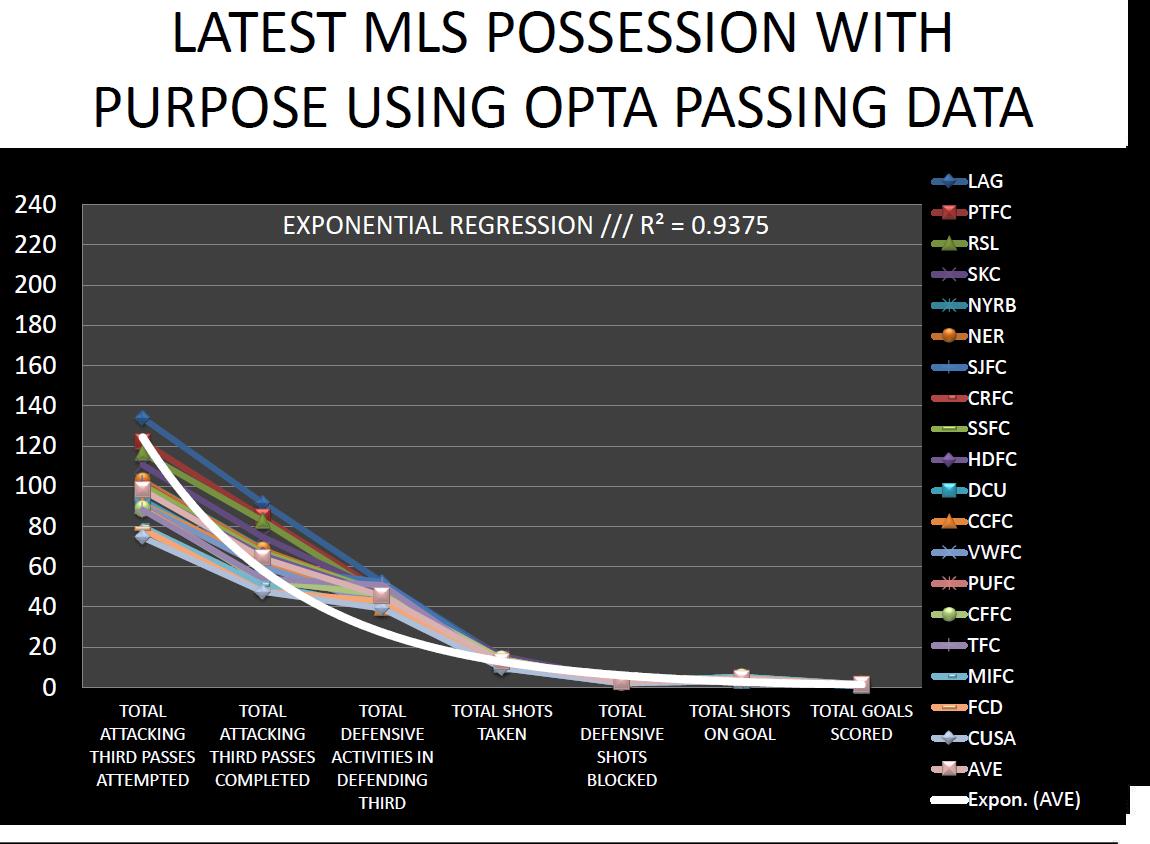
EXPONENTIAL REGRESSION PWP WITH OPTA PASSING DATA
Now the Polynomial Regression – note the R2 = 9870
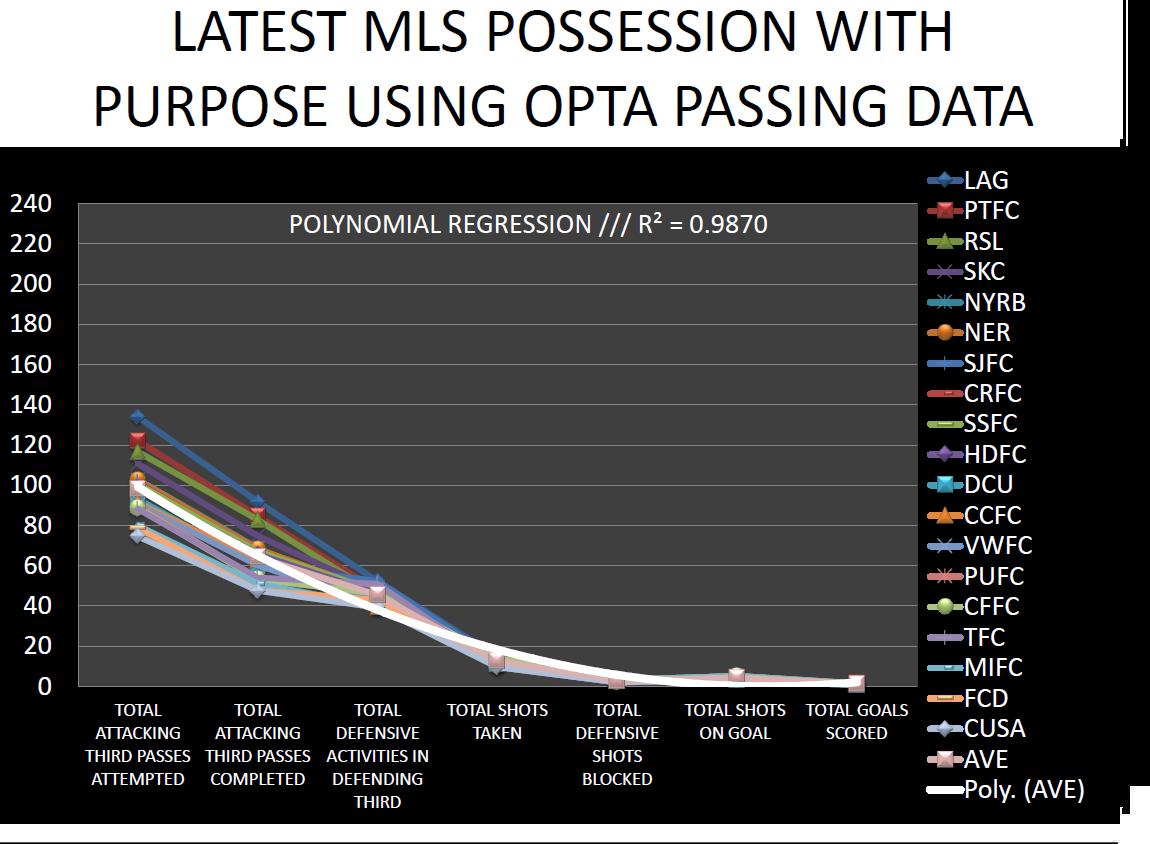
POLYNOMIAL REGRESSION PWP WITH OPTA PASSING DATA
For those curious – the closer to “1” the better.
In considering this data represents the averages for every team in MLS this year (combined games about 420 or more) that’s a pretty tight line and the distribution for each team is pretty strong.
Note LA Galaxy, the blue line at the top and Chivas USA, the light blue line, at the bottom… go figure.
Now on to Portland for this year… first the Exponential Regression where the R2 = .9337
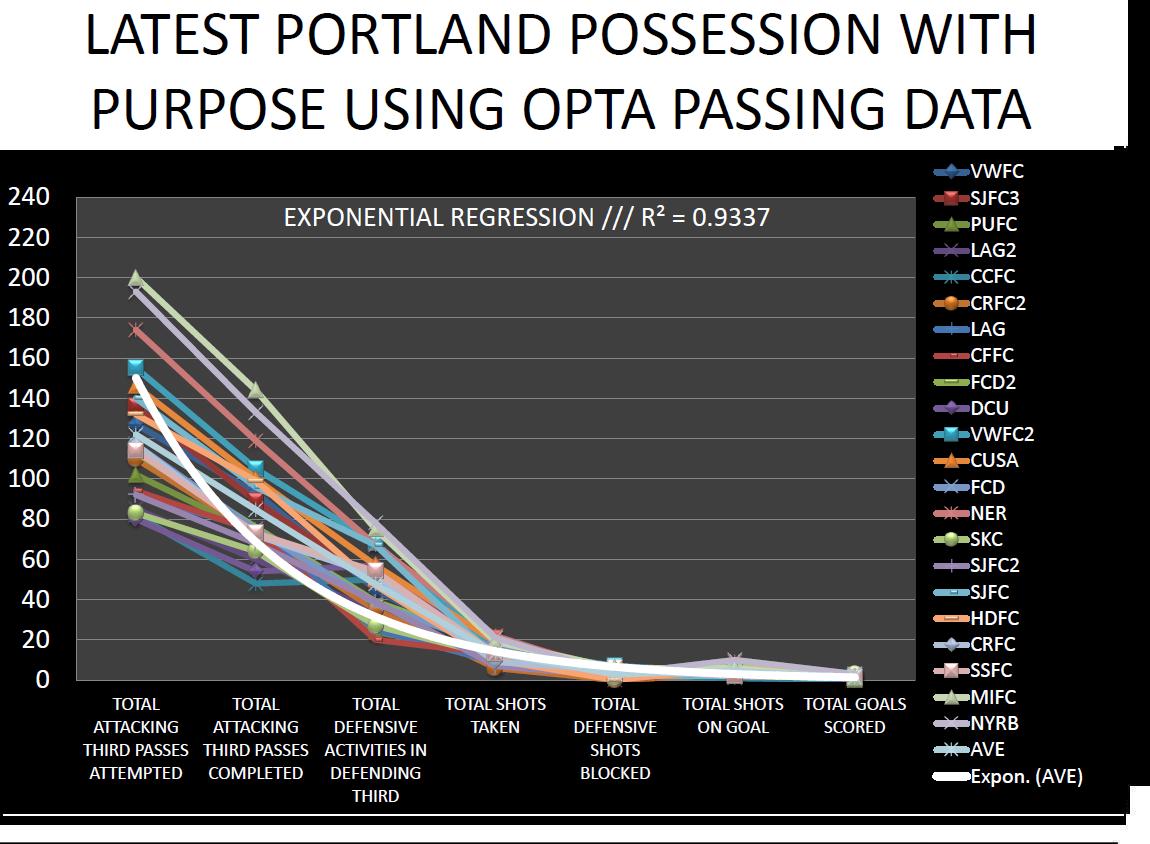
PORTLAND TIMBERS EXPONENTIAL REGRESSIONS REGRESSION PWP WITH OPTA PASSING DATA
Now the Portland Timbers for this year… with the ‘Polynomial Regression where the R2 = .9914
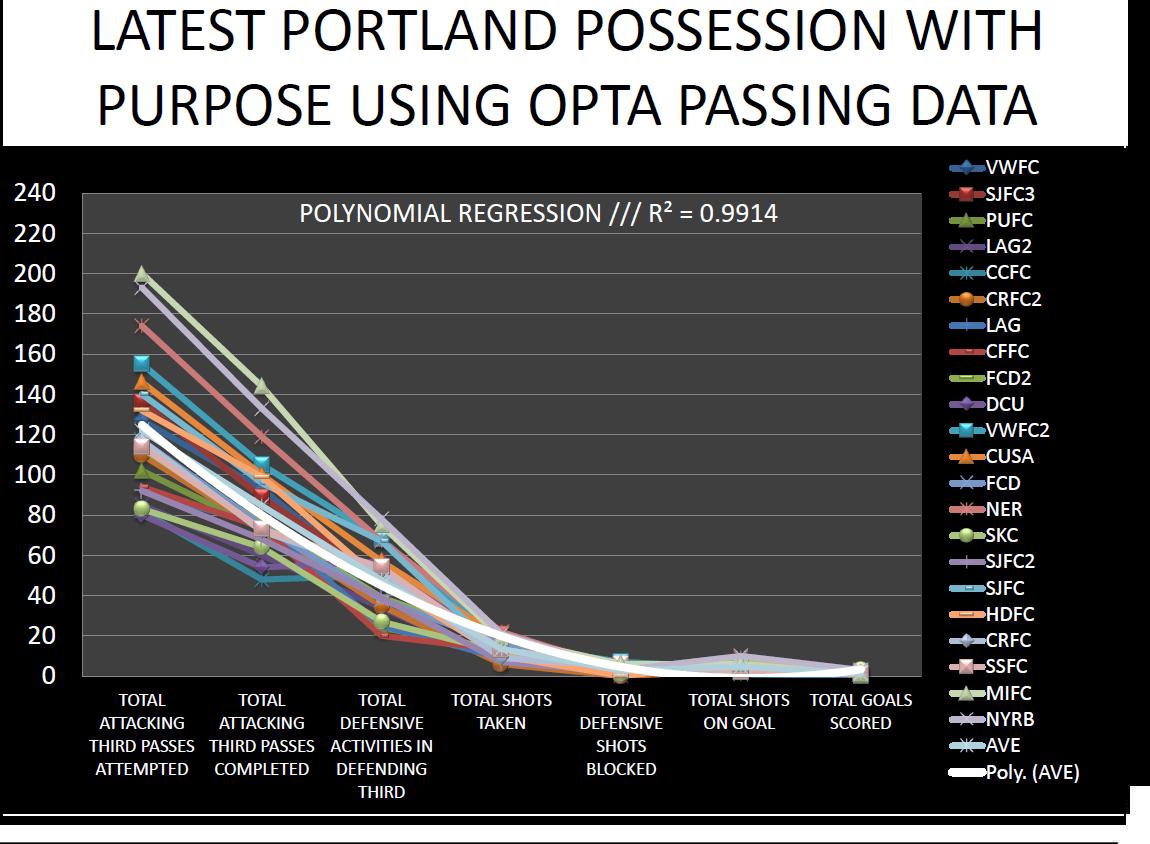
PORTLAND TIMBERS POLYNOMIAL REGRESSIONS REGRESSION PWP WITH OPTA PASSING DATA
Again the R2 is greater for the Polynomial Regression – and in considering my previously collected data (by hand) hovered around .98 this analysis seems to indicate a better way to assess and analyze Portland’s attacking efficiency than before.
Note also the top three lines (light green, kinda light purple, and somewhat faded red (sorry about the color choices) – those three games were against Montreal, New York and New England – in the Montreal and New England match those two teams parked the bus and as a result Portland showed more passing – in the game against New York it was simply – flat-out – open wide.
The attacking approach for Portland has changed considerably since those first two games and this data confirms it as much as my own data collected this year does.
Before digging into the Defending Efficiency Index here’s the bar chart diagrams I didn’t offer yesterday…
First up the Passing Efficiency for all MLS teams – a reminder that the green bars represent current playoff teams.
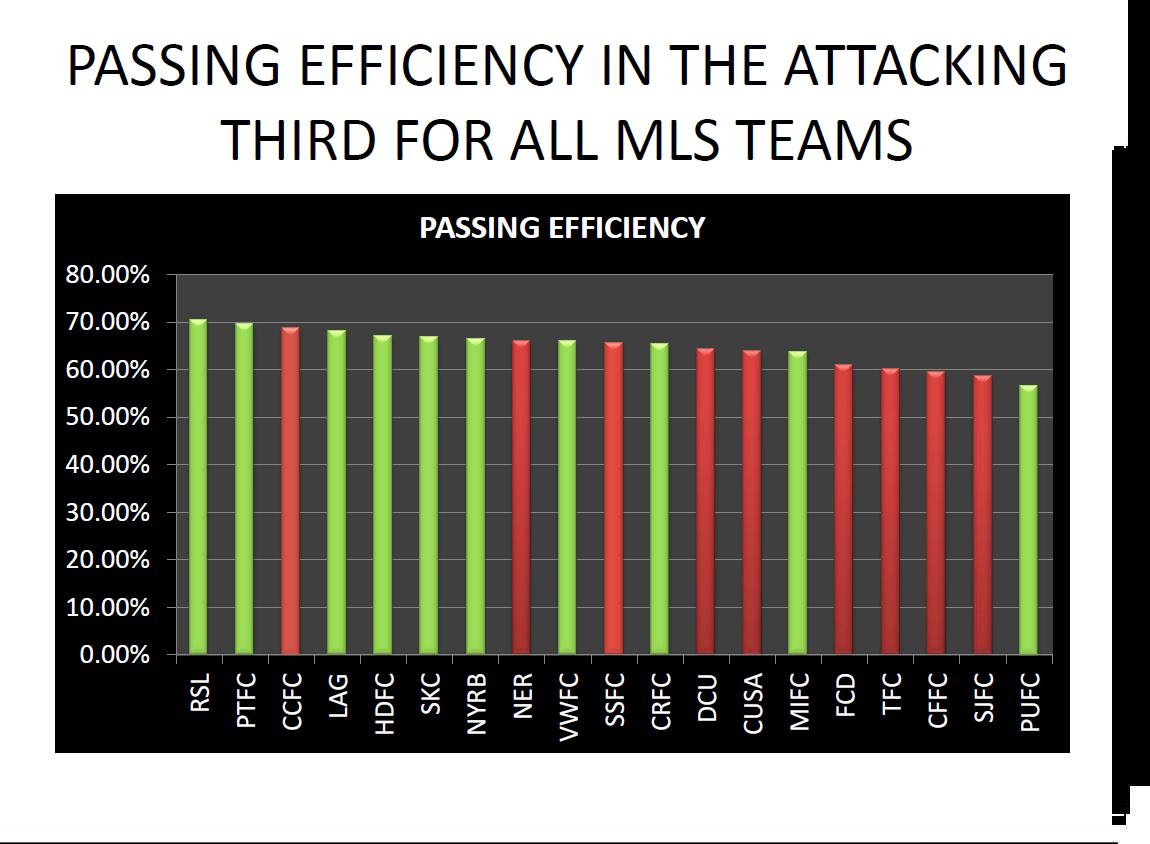
PASSING EFFICIENCY FOR ALL MLS TEAMS TO DATE
Next up a new one I didn’t discuss yesterday…
Shots taken vs successful passes in the final third…
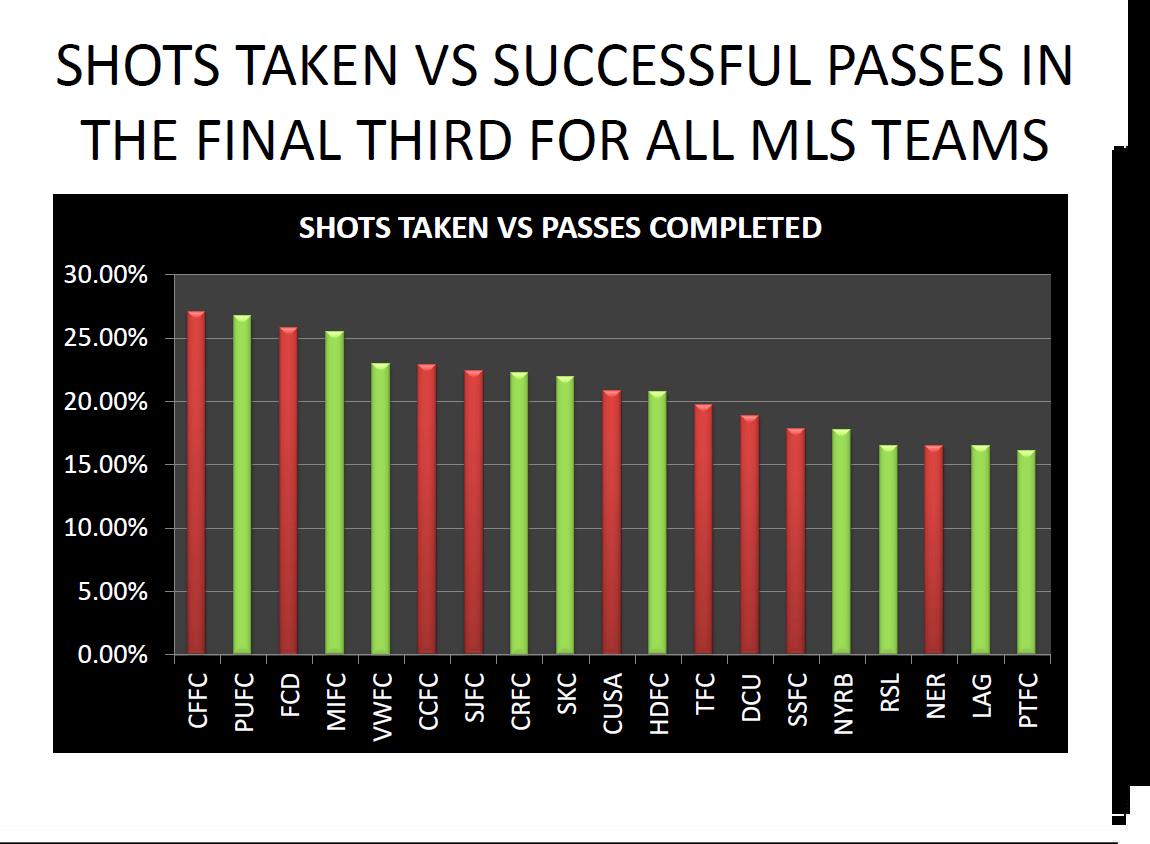
SHOTS TAKEN VS SUCCESSFUL PASSES IN THE FINAL THIRD
For the better part of the last 2 months or so I’ve been speaking to the phrase ‘quantity vs quality’; this diagram does a great job of reinforcing that the quantity might be higher for Portland but the quality in getting shots taken is not… note also that both Real Salt Lake and La Galaxy are on the back-end of this diagram while Chicago Fire and Philadelphia are on the front end….
Next up Shots on goal versus Shots taken for all MLS teams to date…

SHOTS ON GOAL VS SHOTS TAKEN FOR ALL MLS TEAMS
Note how Philadelphia and Chicago drop somewhat while Real Salt Lake and Portland make a huge jump up front – pretty strong indicator that the primary target strikers for Real and Portland are considerably more accurate when they do get their shots off. LA has also increased but remains mid-pack.
Now where the rubber meets the road and the single greatest indicator relative to points in the league table – goals scored vs shots on goal…
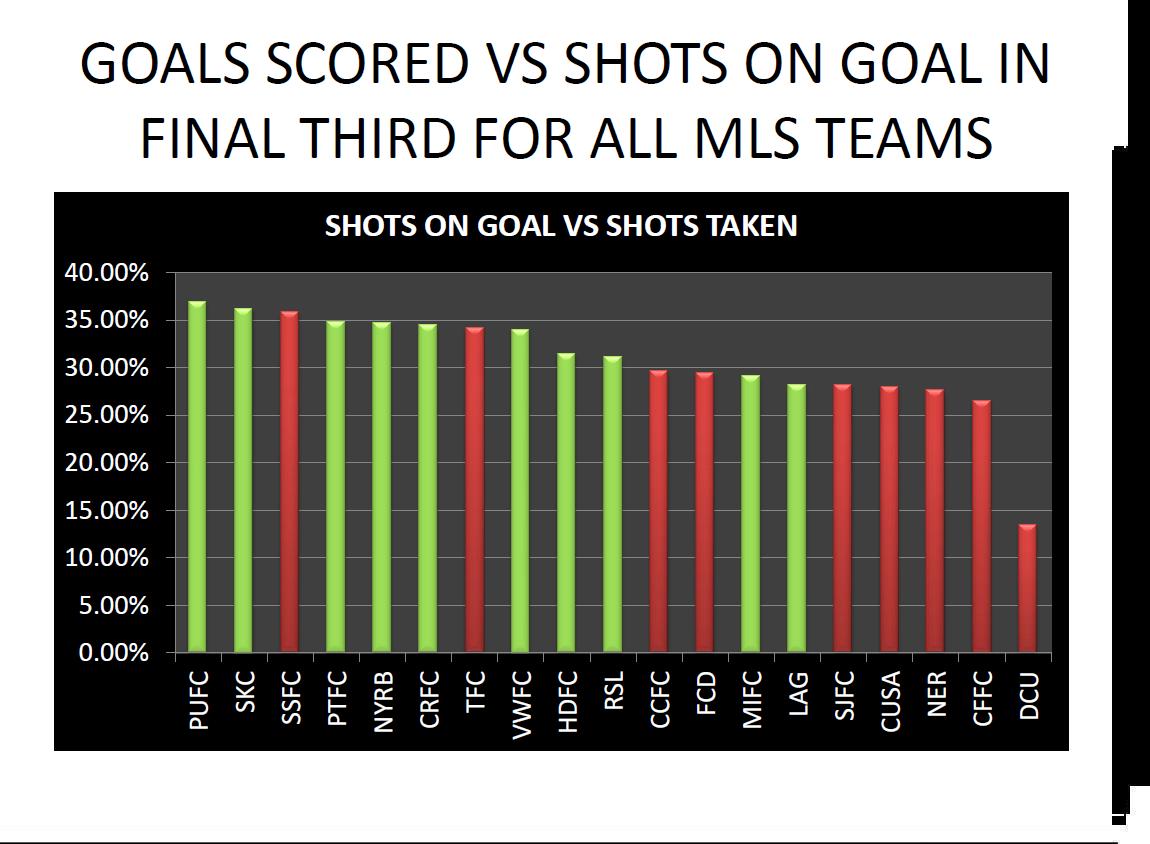
GOALS SCORED VS SHOTS ON GOAL FOR ALL OF MLS
Philadelphia has climbed back into the top five at number one while Portland stays close by and Real slightly drops off – again LA hangs about near the bottom half.
No need to focus on the bottom dwellers – it should be pretty obvious that DC United and Chivas will hang about near the tail end.
So with that there’s the most recent, comprehensive data array on all final third attacking activities for every MLS team, to date.
On to the Defensive side of things and how those compare and contrast with the league table.
First up Defensive Activities vs Passing Attempts…

DEFENSIVE ACTIVITIES VS PASSING ATTEMPTS FOR ALL MLS TEAMS TO DATE
Green bars and red bars as normal – note how effective Sporting KC is in looking to shut down initial passing attempts within the final third – with their attack being a bit weaker this year that seems to give a good indication on why they still continue to get points in the league table.
Notice that Portland retains a usual ‘top five’ position – the defending side seems to be working just as well, if not better than the attacking side and with five different primary center-backs this year it would seem the overall ‘plug-and-play’ is really a reality more than a sound-bite.
On to the Defensive shots blocked vs shots taken…

DEFENSIVE BLOCKED SHOTS VS SHOTS TAKEN
An interesting statistic here – not much relevance to position in the league table here but blocking shots before they reach the keeper usually means last second defensive play as opposed to closing down and tackling to stop the shot to begin with.
Note that bottom dwellers Toronto and DC United are near the top in shots blocked… and that the only team in the top 7 who is currently up for the playoffs is Sporting KC. Oddly enough they are top of the table when it comes to stopping the initial final third pass as well…. can anyone say (strong bloody defense)?
As for Portland – like many other teams in the playoff mix they are in the bottom half – what I would offer here is perhaps the intent of the back-four is to ‘not’ block shots (and create deflections) but to clear a lane for the Goal keeper to have a better chance in saving a shot that he can see; perhaps others may have a different view on that?
So with that here’s Goal Keeper saves vs shots on goal…
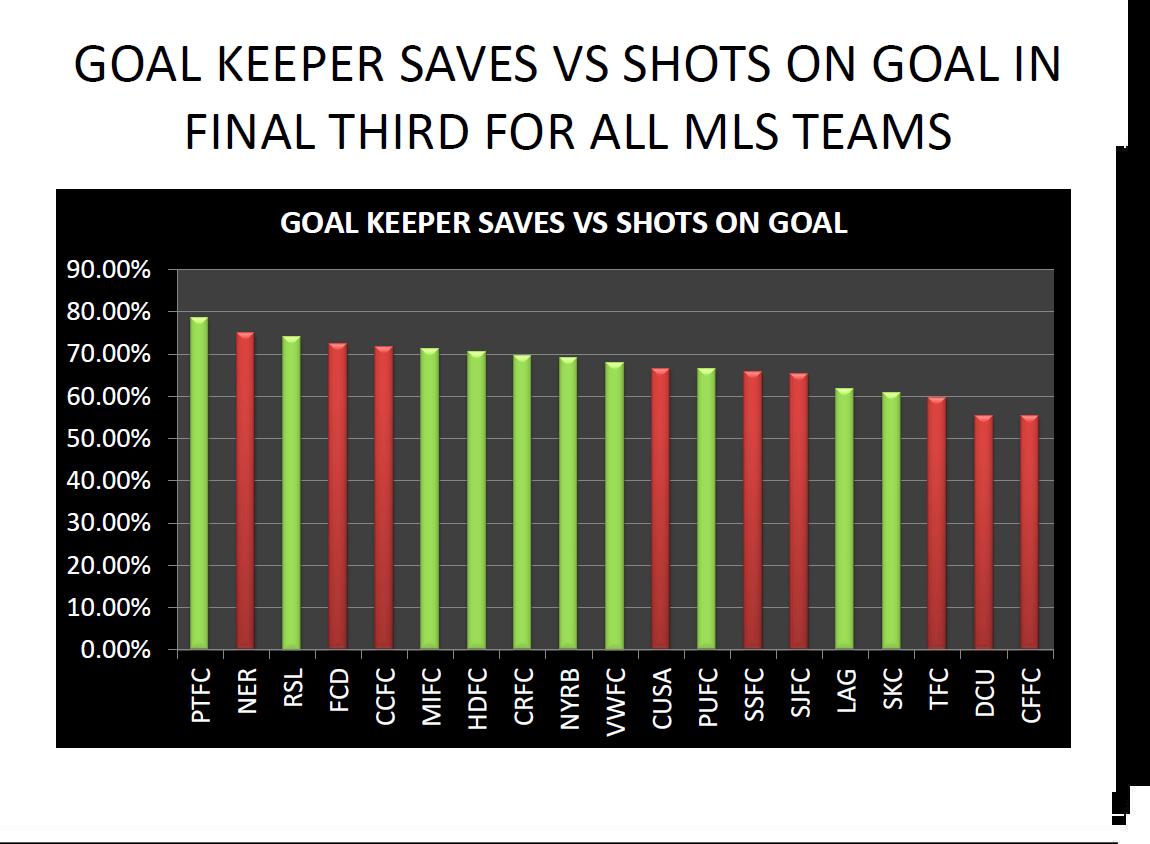
GOAL KEEPER SAVES VS SHOTS ON GOAL
Again, where the rubber meets the road in defending the final third…
Note Portland, and Mister Fantastic, Donovan Ricketts is at the top of this table – oddly enough four of the bottom five teams in this category rank in the top five for blocked shots… perhaps there really is something to ‘letting the keeper see the ball longer’ in order to increase save opportunities and reduce deflections?
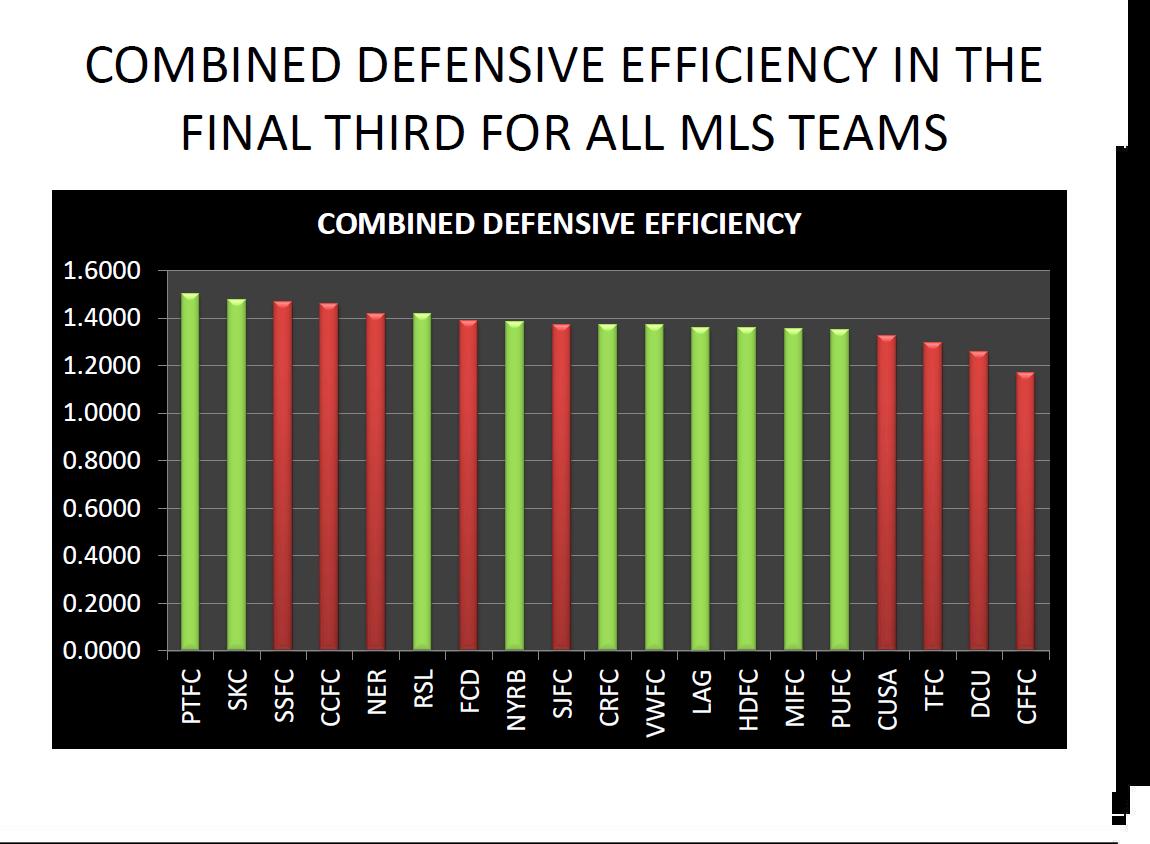
Last but not least the Combined Defensive Efficiency Index for every MLS team, to date, this year.

COMBINED DEFENSIVE EFFICIENCY INDEX FOR ALL MLS TEAMS TO DATE
This Index is a compilation of all the other categories added together… nothing else is added to the mix. Some have looked at goal keeper data that includes shots blocked by the defenders but as yet, until now, no-one has looked at this overall combined information to create a Defensive Efficiency Index.
For now Portland is at the top and Sporting KC is second up. The primary reason for that is the more effective play of Donovan Ricketts.
Another interesting output in this for me is how low some of the teams in the playoff chase are compared to others… defense seems to be the second concern in this league for many teams and who knows how high those playoff teams might be if their defensive play was as strong as Portland’s or Sporting’s.
Time enough remains and while many might consider the Seattle game a chance for some heavy duty fireworks it is quite possible, in viewing this data, to expect a grind where maybe, just maybe, one teams beats the other through a set piece.
All for now as I prepare for a Match Preview in the upcoming game against FC Dallas…
Chris Gluck
I have been covering the Portland Timbers and Major League Soccer, as a community blogger/analyst for the Columbian Newspaper, since June, 2012. Since then my involvement in soccer analysis has expanded to include participating in the Regional Emmy Award Winning Soccer City PDX TV Show (Comcast Sports Northwest). My unique analytical approach has been published in Europe and presented at the World Conference on Science and Soccer 2014. I also appear regularly as a co-host on Rose City Soccer Show and the Yellowcarded Podcast. You can find my work on PossessionwithPurpose.com, PTFC Collective and Prost Amerika.