
Major League Soccer – “The Final Third” – Who’s best, who’s worst, and who’s on top of a new MLS Attacking Efficiency Index?
For me the Final Third represents the most dangerous area (both in attack and defense) for every team in football.
In considering the breadth of publicly available information on the MLS web site, provided through OPTA, I decided to embark on a journey to see just what teams are the most effective in the Final Third.
Before getting to the actual data, and the ‘so-what’ associated with that data, here are some conditions to set the tone…
1. Every game was reviewed using the OPTA Chalkboard (to date) as well as the MLS Stats data provided as part of game recaps.
2. In case you didn’t know you can filter areas of the OPTA Chalkboard – so when collecting my data it was necessary for me to filter every game to count totals.
3. Totals counted in the Final Third included 1) Passing attempts within the final third, 2) passing completions within the final third, 3) Defensive activities in the final third that included Tackles won, interceptions, crosses blocked and clearances, 4) Shots Taken, 5) Shots Blocked, 6) Shots on Goal, 7) Goals saved by the Keeper, and 8) Goals Scored.
4. I did not track ‘recoveries’ because a recovery is a loose ball within the final third and either no-one possessed it or it came about as a result of a unsuccessful pass. Basically, I tried not to ‘double count’ and relevant statistics — others may have a different view on that?
5. In two cases OPTA data was not available – one was a match between Chicago Fire and Sporting KC in July and the other was a match in June between New England and Vancouver.
6. If you track Golazo passing statistics these numbers will be different; why? Because Golazo tracks passing percentages based upon ‘penetrations’ into the final third, whereas OPTA – when using their filter – track passing details ‘within’ the final third. It is a small detail but critical.
7. This data also does not track dribble penetrations within the final third.
8. Shots blocked are counted after Shots taken and before Shots on goal – this is to recognize that a blocked shot is a shot ‘not faced’ by the goal keeper.
9. All data is subject to error – in collecting passing data it appears that some ‘key passes’ from corners are not included (at times) in the filtered passes information. So additional passing attempts and completions (most around 2 to 4) have had to be added to some game totals.
So with those conditions set here’s some data outputs and the so-what for your consideration…
1. It should probably come as no surprise that the top 5 teams with the most passing attempts in the final third are 1) LA Galaxy (134), Portland (122), Real Salt Lake (117), Sporting KC (111) and New York RB (103).
2. On the other hand I was slightly surprised to see that Chicago Fire with 5th lowest with (89), Toronto was 4th lowest with (88), Montreal 3rd lowest with (80), I was also very surprised to see that Dallas was 2nd lowest with (79) while Chivas brings up the rear with (75) average passes attempted.
3. The so-what – for me I guess it comes down to racking and stacking what teams are more ‘possession based’ than direct, or counterattacking based.
4. As for Chivas USA, I’d offer they are on the low end simply because they don’t have the player talent pool to compete with the rest of the league.
5. In considering that the majority of games Montreal play are more likely to be ‘counter games’ or ‘parking the bus games’ it’s no surprise they are that low on the totem pole.
6. Other teams in the middle of the mix like New England, San Jose, Colorado, Seattle, Houston, DC United, columbus, Vancouver and Philadelphia appear, to me, as teams that can play possession based but when going up against stronger possession based teams they tend to revert to counterattacking or direct attacking.
7. I suppose one might also offer that teams on the lower end of the spectrum might not attack with as many players given they might feel or think their back four isn’t quite as strong as some other teams.
Completion percentages of passes in the final third…
1. Again no surprise here that Real Salt Lake has the best overall percentage complete on passes made in the final third (70%). Others in the top 5 include Portland 2nd with (69.5%), Columbus (big surprise) with (68.8%), LA Galaxy 4th with (68.1%) and Houston rounding out the top 5 at (67%).
2. On the bottom end of the scale is Dallas with (61%), Toronto (60.2%), Chicago at (59%), San Jose at (58%) and Philadelphia at (56.6%).
3. The so-what – for me, working bottom to top I’d offer that teams like Philadelphia, San Jose, and Dallas probably fall more into a direct attacking team category; therefore their close-in foot skills might not be as good as others.
4. Why Philadelphia and Toronto fall in the bottom five isn’t clear to me other than Toronto might simply not be a very good team. Others with more knowledge about Chicago might be able to explain the poor completion percentage. In looking at their first ten games versus the next 12 games their average hasn’t changed much at all. So the addition of Magee hasn’t impacted passing accuracy ‘but’ the latest arrival of Arevalo Rios may change things.
5. I think most would agree that Real, Portland and LA would be up near the top on percent complete; what I didn’t expect, but am not surprised to see is how high on the ladder Houston is. They remain a quality side and for me, is the best sleeper coming from the Eastern Conference.
6. As for Columbus – wow – they don’t do much work inside the final third but when they do they appear to do it quite well. Perhaps Columbus represents a team who has been ‘unlucky’ this year? More later when talking to the attacking and defending efficiency index information.
Shots on Goal vs Shots Taken…
1. Top Flight in this category is Montreal at (43%), with Real on (39.9%), Dallas on (36.8%), Chicago at (36.4%) and Portland at (36.3%).
2. Bottom feeders from 5th last to worst in converting shots on goal from shots taken is Columbus (32.6%), Colorado (31.8%), Sporting KC at (31.2%), Houston (30.6%) and last, and most least, DC United at (30.4%).
3. So what – Well it is interesting to see that while Columbus does pretty good in passing completion percentage in the final third they are near bottom when it comes time to creating shots that hit the target. Perhaps that might explain their lower standing in the Eastern Conference league table?
4. To be honest I was pretty surprised that Kansas City was so low in this category – some might offer that they haven’t been quite as dominant this year and with Besler and Zusi being out for some time in support of the USMNT it’s no wonder. How Sporting deals with their departure for more World Cup qualifiers could be an issue.
5. In looking at the other bottom feeders here it’s also a bit surprising to see both Houston and Colorado on the short side of things – maybe this had more to do with the quality of their strikers than anything else – and with Torres being picked up by Colorado maybe that will change things as the year winds down?
6. With respect to Houston, I don’t know – maybe we see Portland take a stab at trying to reel in Will Bruin – Nanchoff seemed to get better working under Porter and maybe that might be the case with Bruin. Those following Houston will probably know better on that one.
7. In considering the high flyers here; Montreal has an old-school striker in DiVaio and Chicago have recently added Magee – Saborio and others with Real contribute goals while Portland has a strong group of guys with 5 or more.
8. As for Dallas; not many chances but Perez and Cooper seem to do quite well in putting them on target when they get the chance – if they are playing more direct than previously it would appear they are much more successful at it than San Jose.
Goals scored vs Shots on goal – where the rubber meets the road. No matter how you slice it the single most important statistic relating to points in the league table is the ability to put the ball in the back of the net. Here’s the top five and bottom five in MLS.
1. DC United is worst at (13%). A big jump up finds Chicago 2nd worst at (26%); 3rd worst is New England (27%); 4th from bottom is Chivas (27.9%) and 5th worst is San Jose at (28%).
2. The top flyers this year, to date, are New York, 5th, (34.6%), Portland, 4th at (34.7%), Seattle, 3rd at (35.8%), Sporting KC, 2nd at (36.1%) and best of the best – wait for it – Philadelphia (36.9%).
3. The so-what – Quite a contrast in a couple of different statistical areas with only one team consistently in the top 5 in all those areas – Portland…
4. It shouldn’t come as a surprise that New England is so poor in this area; they haven’t brought on any top flight strikers this year and they were near bottom last year… they remain a ‘park the bus type team on the road’ and I’m not sure what you could call them at home… They also happen to be third worst in shots taken and 6th worst in shots on goal. It should come as no surprise they are on the outside looking in when it comes to the playoff chase.
5. Two of the 5 worst are bottom feeders this year – DC United and Chivas – and that’s not just their average either – both teams are consistently low in volume for shots taken and total shots on goal (both in the bottom five for both categories).
6. Given all other conditions, converting shots on goal to goals is about productivity – and with Philadelphia, Sporting, New York and Portland all in the top five in the league table it’s not a surprise to see them with a higher conversion rate. Seattle remains a sleeper (REALLY HATE TO SAY THAT!) and with 3 games in hand – plus the addition of Dempsey – this team could be quite dangerous; and I haven’t even broached the Defensive Efficiency Index data yet…
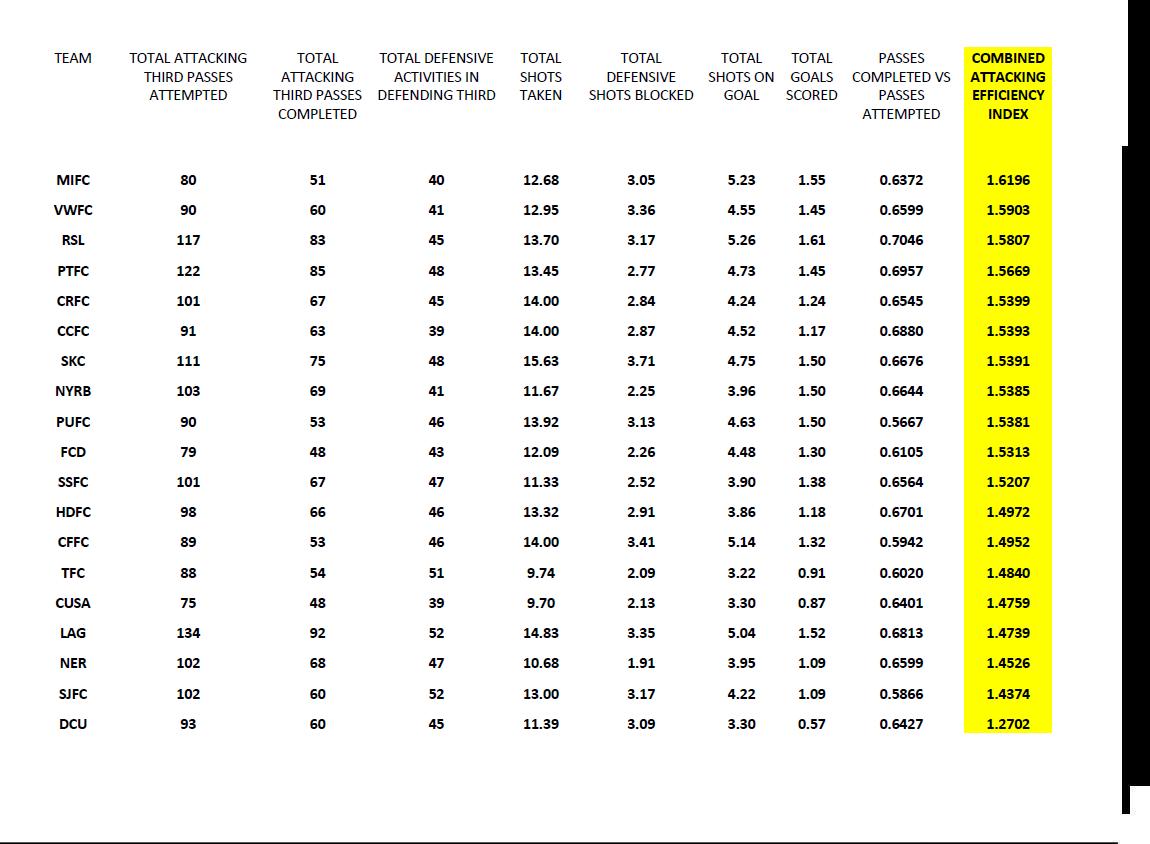
With that said here’s the overall Final Third Attacking Efficiency Index to date…
First up is the data table from my excel spreadsheet; what is provided is all the basic data collected (and averaged) for this effort.
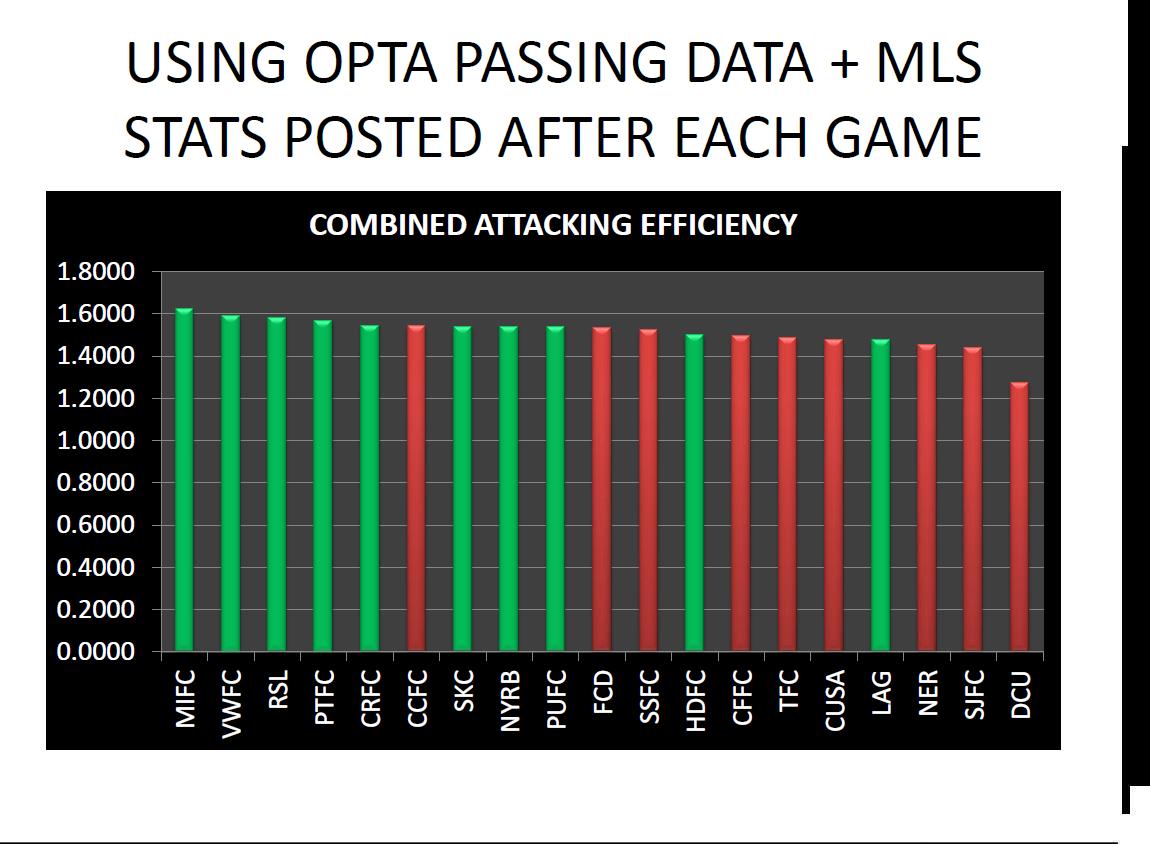
The next diagram, below, provides the picture (left to right) showing the final Attacking Efficiency Index for each team to date.
ATTACKING EFFICIENCY INDEX USING OPTA

BAR CHART ATTACKING EFFICIENCY INDEX USING OPTA
Observations…
1. All five of the top five teams in overall attacking efficiency, for this Index, are in the top five of their conference table.
2. As noted earlier Columbus are pretty good getting shots on goal while also averaging more shots taken in addition to having a 68.8% completion rate for passes in the final third. Their letdown seems to come when trying to convert all that positive activity to a goal – a better striker (or fewer injuries to key players) might see them in the playoffs?
3. Another note on Columbus – if memory serves they’ve had like 6 or 7 games in a row at home where their opponent has had a player red-carded – I didn’t filter Penalty Kicks out of goals scored and I’m not too sure how many PK’s Columbus have had but it might explain some higher efficiency numbers.
4. Note how far down the list LA Galaxy are… what gets them near top in most categories is ‘volume’ – they, by far, average more pass attempts and more pass completions than anyone – what hurts is their ability to convert that quantity into quality. Don’t get me wrong, LA can and does score, luckily for other MLS teams they don’t score four goals in every half like they did against Seattle earlier this season.
5. As expected, Portland were in the top 5 on all primary categories, and again they are here as well – solid – strong and a realistic contender for the Championship… 7 games out of 12 at home to include Toronto with Chivas twice on the road.
6. No – no prognostications here… one game at a time – rigid flexibility with consistency of purpose in possession with the intent to score while preventing the opponent from scoring.
7. It’s pretty hard to quantify the value of an Index just over halfway through the season but the outcomes seem reasonable and the relationship between the data points seems reasonable; I’ll offer up those plus my Defensive Efficiency Index later this week.
8. As each week passes I will update this Index and try to offer up some ‘so-whats’ where I can.
Next up my Defensive Efficiency Index…
Chris Gluck
I have been covering the Portland Timbers and Major League Soccer, as a community blogger/analyst for the Columbian Newspaper, since June, 2012. Since then my involvement in soccer analysis has expanded to include participating in the Regional Emmy Award Winning Soccer City PDX TV Show (Comcast Sports Northwest). My unique analytical approach has been published in Europe and presented at the World Conference on Science and Soccer 2014. I also appear regularly as a co-host on Rose City Soccer Show and the Yellowcarded Podcast. You can find my work on PossessionwithPurpose.com, PTFC Collective and Prost Amerika.