A hard look at COVID-19 data keeping Southwest Region in Phase 1 and data shows for the future
The numbers came on Friday, and they weren’t good.
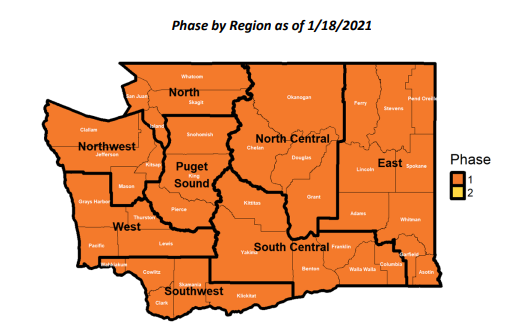
Every region in the state saw its number of new COVID-19 cases go in the wrong direction, meaning no region will be moving to Phase 2 of the Healthy Washington reopening plan on Monday.
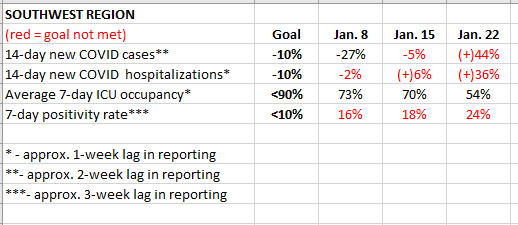
The Southwest Region again only met one of four metric thresholds required to move to Phase 2, which is needed for sports like football, volleyball, girls soccer and slowpitch softball to begin their seasons.
So let’s take a deeper dive into the numbers.
We’ll start with the rate of new COVID-19 cases, which rose by 44% in Southwest Region in the report released Friday.
That was based of a case rate of 475.4 per 100,000 residents over the two-week period of Dec. 27 to Jan. 9, compared to 329 from Dec. 13-26. Those numbers closely mirror the rates Clark County reported over a comparable time period (474 to 325).
If that trend holds, we can use Clark County’s numbers to project where this metric will fall next week (Note that most of the data released every Friday from the state includes a lag of one to three weeks).
When county health announced its two-week COVID cases every Tuesday, it does so with a six-day lag to catch any errors in reporting. That means the reporting days end the preceding Wednesday. So if we take the daily totals the county reports, we can estimate fairly closely what next Tuesday’s number will be. And that number for next Tuesday should be about 402.
So if we compare that number with the previous two-week number of 398, it will show a gain of 1%.
That’s an improvement, but still not below the necessary threshold of a 10% decline. So, we can project that when data is released next Friday, the Southwest Region still won’t qualify to move to Phase 2 on Feb. 1.
That’s the bad news. The good news is things should improve the following week. That’s when that the most recent data will be compared to that very high 475.4 case rate. Then the subsequent case rate needs to just be at 427 to show 10 percent decrease. That appears very attainable.
The next metric – the trend in 14-day rate of new COVID-19 hospital admissions per 100K population – is harder to get a read on.
The current 36% rise in that metric is based on the rate of 14.1 from Dec. 20 to Jan. 2 compared to 19.2 from Jan. 3 to Jan. 16.
Now Clark County Public Health does not release new COVID-19 hospitalizations (at least that I see) on its COVID-19 website. But it does release how many COVID-19 patients are currently in the hospital. And that number is on the decline.
On Friday, Clark County reported there were 53 patients hospitalized for COVID-19. Last Friday, that numbers was 78. So we can expect that number should soon be on the decline.
The third metric – ICU bed capacity of below 90% — continues to be good in Southwest Region. After reporting 73% and 70% the first two Fridays, this most recent number was at 54%. So that remains good.
Now we get to the last metric, and possibly the most troubling. The positivity rate of COVID-19 tests. This number appears to be on the rise, going for 16% to 18% to now a state-high 24%. It needs to be below 10%.
But there is a grain of salt to be taken with this metric. It is measured in a seven-day period. Also there is a three-week lag in reporting.
This 24% is from Dec. 27 to Jan. 2. So if other metrics are improving with more recent data, it is possible that this metric can also improve. It just needs time to do so.
And there is another factor. If we look at Clark County’s tests, we can see that from late November into early December, the county was administering about 10,000 tests a week.
But during the two weeks around the holidays, the number dropped to around 7,200 and 7,900. And guess what? The positivity percentage went up.
Now the state measures positivity differently than the county. The county’s rate is a percentage of positive tests out of all tests administered. The state excludes repeat tests. In other words, folks like first responders or front-line health care workers, who get tested regularly and repeatedly, aren’t counted in the state’s number, giving the state a better picture of the general population.
I don’t have the state’s numbers for the region going back into December. But the county’s numbers were much better in late November and early December, giving hope that they may be improving in the coming weeks.
The other question is how far and how fast they can improve, because the current 24% is a long way away from the needed 10%.
So, in short:
- The Southwest Region won’t be moving to Phase 2 on Monday.
- The region also is very unlikely to be moving to Phase 2 on Feb. 1.
- But moving by Feb. 8 still remains a possibility. How possible, we don’t know. But we’ll get a better indication when positivity rates are reported next week.
For high school sports to begin competition as scheduled by the week of Feb. 8, the region needs to be in Phase 2 on Feb. 8.
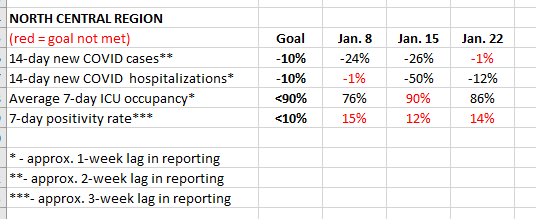
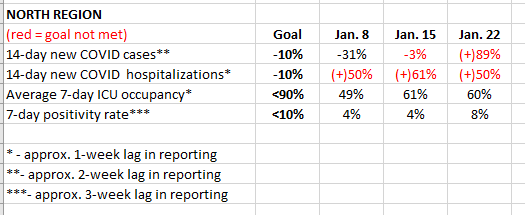
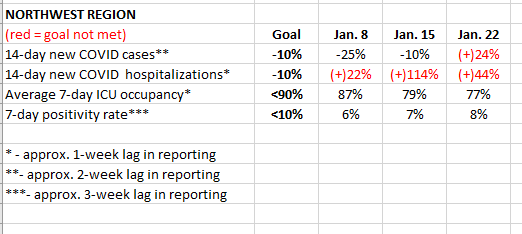
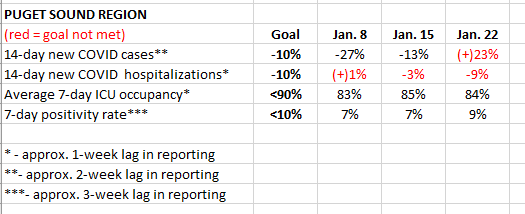
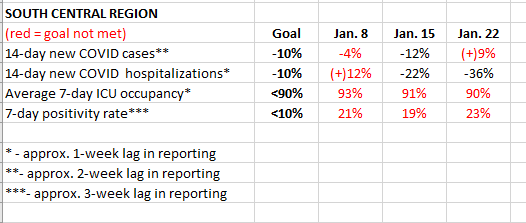
Now let’s take a look at the numbers from the past three Fridays look in each of the state’s eight regions.
We start with the Southwest Region.
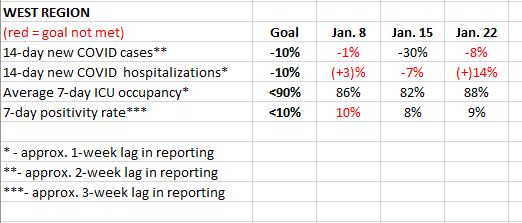
But now we’ll look at the West Region, which encompasses Lewis, Thursday, Grays Harbor and Pacific county. Last week, the West Region came oh-so-close to making it into Phase 2, just missing one last metric by three tiny percentage points.
If the West had moved to Phase 2, it would have stayed at Phase 2 this week, even though this week’s numbers weren’t as good last week. To stay in Phase 2, a region only needs to meet 3 of the 4 metrics, and on the metrics that measure decline, those just need to remain flat. If that were the case this week, the West would have met three metrics to stay at Phase 2.
And here are the other regions. Of note, every single region reported worse numbers this week for new COVID cases and positivity rates when compared to last week.