
Defensive Shots Blocked – A deeper dive into MLS.
In my most previous blog about the Portland Timbers I had noticed an unexpected oddity in the data analysis when peeling back Defensive Blocks by Chivas from game 1 to game 2.
I had expected systemic defensive changes (given Chivas moved from a 3-5-2 to a flat-back-four) like increased interceptions and clearances and decreased tackles but considering how a change in defensive blocked shots might influence things wasn’t part of it.
As a reminder Chivas blocked 19% (4) of the Timbers shots taken in game one and 41% (5) of the shots taken in game 2. True – fewer shots taken (21 game 1 and 9 in game 2).
In recalling what I saw – Portland had only taken 5 out of 21 points when the opponent blocked five or more shots I thought I would check around with other teams in MLS and see what I could see.
Here’s a snapshot of some teams and their percentage of taking points in the league table based upon the opponents’ number of blocked shots.
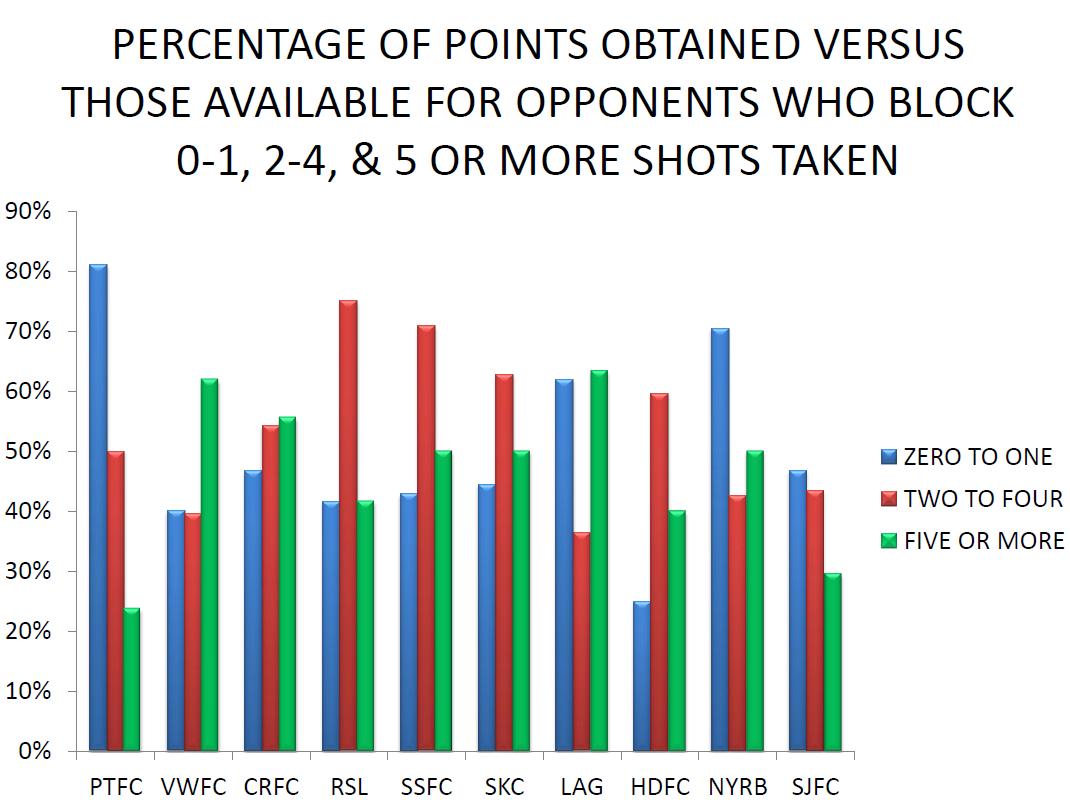
PERCENTAGE OF POINTS OBTAINED VERSUS THOSE AVAILABLE COMPARED TO OPPONENTS SHOT BLOCKING
Observations:
- The blue bar represents percentage of available points taken based upon the opponents number of blocked shots that are zero to one.
- The red bar is for those that were 2-4 and the green bar is for those that were five or more.
- In offering up some other teams in the diagram it’s pretty clear that this tendency is not the norm across MLS since only San Jose has a pattern that is somewhat similar.
- So for me, I’m thinking that without other individual data on who’s blocking what for each team this is really a rabbit hole not worth going into too far.
- Suggestion to MLS – make more data available on Team and Individual Shot Blocking…
That said here are some thoughts to consider (there are others…)
- Sometimes teams that play tighter defenses inside the 18 yard box are more inclined to try and block shots as opposed to closing down and trying to tackle.
- Sometimes more open games (where both teams are spread) tend to have fewer blocked shots are more players are out of position.
- If a team is noted for accuracy in passing across the pitch then another, less talented team, might? yield that space and wait for the space to naturally tighten inside the 18 yard box?
- Less accurate strikers may have more shots blocked given they are not as aware of where the opponent is as they should be?’.
- The ideal striking zone to score goals is dead middle, from the goal mouth out to the 18 yard box, the more teams take shots from that area perhaps it is more likely they are to see them blocked.
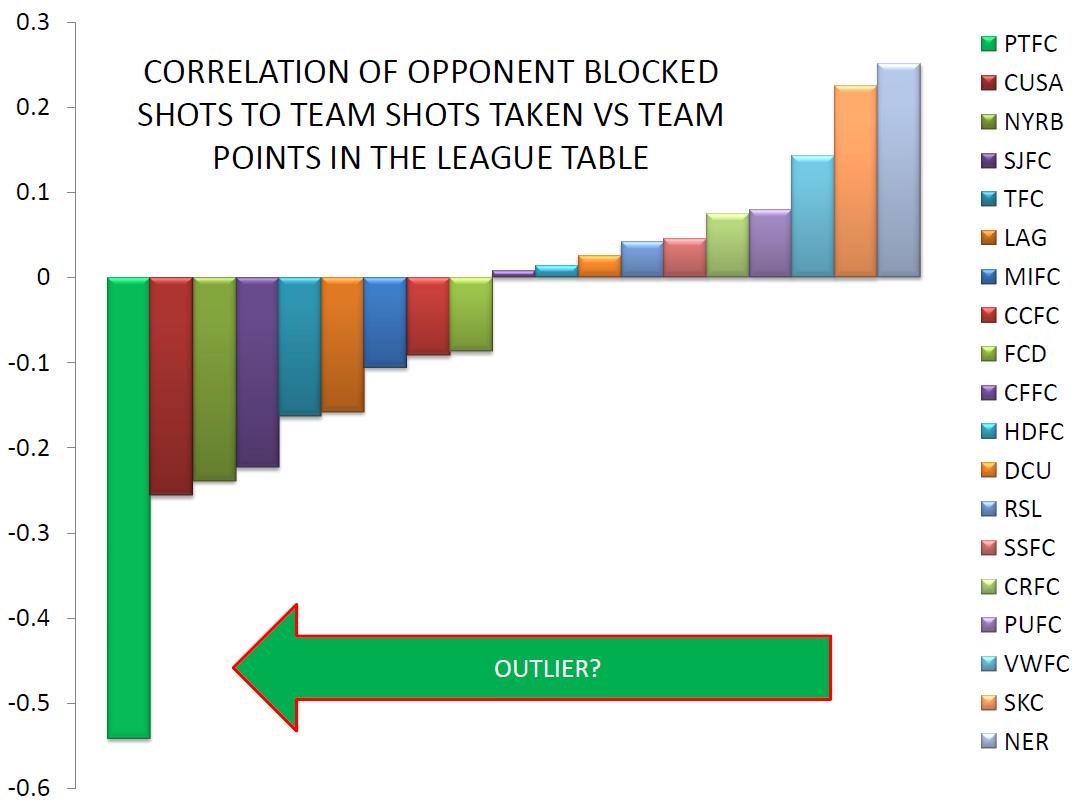
Before closing thoughts here’s one other diagram showing the correlation of defensive blocked shots to shots taken versus points in the league table…

CORRELATION OF SHOTS BLOCKED TO SHOTS TAKEN VS TEAM POINTS IN THE LEAGUE TABLE
Observation:
- Funny that… there is a continuum here going from -.2 to +.2 with Portland clearly outside the line at >-.5?; again perhaps? a reason to not chase this down the rabbit hole too much.
- Not pictured, but worth noting, is that there is a negative correlation (-.5473) between Goal Keeper save percentage and shots blocked by the opponent.
- In other words the more a team blocks the opponents shots the more likely the goal keeper is going to miss a save opportunity when they do get past.
- Also, the correlation of Goal Keeper save percentages to points in the league table is .6591 while the correlation of blocked shots to points in the league table is -.2440.
- In other words it is better for teams to not block shots than it is for them to block shots when considering the outcome impacting points in the league table…
In Closing:
- I would venture to say that Portland has been very unlucky this year in seeing so many shots blocked…
- Perhaps this unusual take on league points, for Portland, has more to do with yielding set-piece goals against (that have impacted league table points) and not ‘how they score goals’!?
Next up my Possession with Purpose MLS Power Rankings…
Chris Gluck
I have been covering the Portland Timbers and Major League Soccer, as a community blogger/analyst for the Columbian Newspaper, since June, 2012. Since then my involvement in soccer analysis has expanded to include participating in the Regional Emmy Award Winning Soccer City PDX TV Show (Comcast Sports Northwest). My unique analytical approach has been published in Europe and presented at the World Conference on Science and Soccer 2014. I also appear regularly as a co-host on Rose City Soccer Show and the Yellowcarded Podcast. You can find my work on PossessionwithPurpose.com, PTFC Collective and Prost Amerika.