
MLS Final Third Power Rankings – Where are the Timbers in all this?
Last week I offered up my first MLS Power Ranking using empirical data collected from every game in MLS this year barring two.
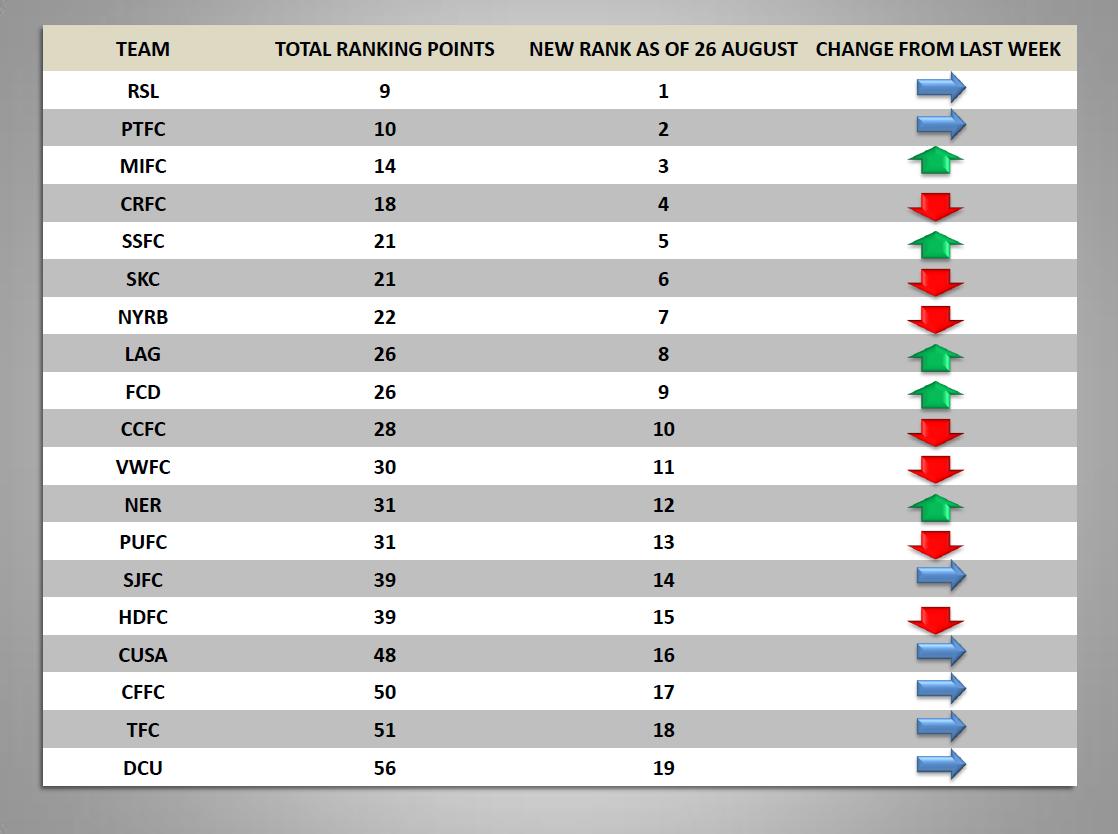
Here’s this weeks Ranking Diagram:

MLS FINAL THIRD POWER RANKINGS AS OF 26 AUGUST 2013
Going in I would expect some changes given the scoreline’s in a few games .
Without going into detail on every team is some thoughts for your consideration on the higher placed teams in this Ranking.
1. Real Salt Lake: No-Change: Does anyone seriously think that a team that executes so well and is the clear leader in total points is really going to move on the first perch? Granted they scored in stoppage time to equalize mid-week against Portland but they simply blew away Columbus 4-nil on the 25th. What was even more impressive about RSL this past week was there ability to gain that 1 point in Portland without the services of Beckerman and Saborio.
2. Portland Timbers: No-Change: Aye, the nay-sayers will be out in full force on this one and I won’t argue but simply offer up a few statistics that continue to resonate with this team throughout the course of this season.
- They ‘still’ have two games in hand with RSL and are still just 6 points behind.
- They, along with Sporting KC, have a 0 Road goal differential.
- They still have lost just 4 games and they have never lost by more than one goal.
- The crux of their defensive issues are not based upon poor ‘run of play’ efforts – they are based on their inability to prevent the opponent from scoring on set-pieces.
- They may be slipping in their goals for (37) is now tied for fifth best.
- There goals against is 26, and that is tied for second (with Seattle) across all of MLS.
- Finally, this ranking is not based upon emotion; it deals with productivity in the final third and the end-result, points in the league table.
3. Montreal Impact: Up 3: A blowout basically and a huge boost to the team as it continues to maintain its place in the top five. It’s not like Houston didn’t show up to play; they had 5 shots in the kill zone while Montreal had 6 – the difference came down to accuracy and the Impact ability to penetrate and score from the Houston right side of the defense. Bernier pretty much ran the show with over 15% of the total team possession and his cohort in crime, Nesta, took care of the back-four handling the ball over 12% of the time. A great takeaway on this team is their continued ability to create chances with minimal possession. Here’s a table below that should reinforce that offering.
| Team | Average of POSSESSION PERCENTAGE | Average of SHOTS TAKEN | Average of SHOTS ON GOAL | Average of GOALS SCORED |
| HDFC AWAY | 0.54 | 15.50 | 3.50 | 0.00 |
| MIFC HOME | 0.46 | 18.00 | 9.00 | 3.50 |
4. Colorado Rapids: Minus 1: No game this week and by virtue of Montreal completely thrashing Houston they dropped one place. Next up Colorado travel to Sporting KC. A bit hard to figure this one given the ups and downs of SKC this year but here’s a snippet of info on how both teams have fared so far. Possession will probably end up in Sporting’s favor and a result of 2-1 against Colorado wouldn’t be surprising. That potential drop in three points should have other Western Conference teams chomping at the bit.
| Team | Average of POSSESSION PERCENTAGE | Average of SHOTS TAKEN | Average of SHOTS ON GOAL | Average of GOALS SCORED |
| CRFC AWAY | 0.49 | 13.67 | 4.25 | 1.08 |
| SKC HOME | 0.60 | 18.92 | 5.54 | 1.77 |
5. Seattle Sounders: Plus 4: A huge move this week but not as big as another Western Conference team. It’s a bit dubious really given that they didn’t really dominate, let alone run rampant on the Timbers with Dempsey plodding along on the pitch. All told he touched the ball about 8% of the time compared to his teammates and in watching the game the hype surrounding him far exceeds the talent he displayed on the pitch. By contrast Diego Valeri, about $7M-$8M(?) cheaper had a glorious game on national TV. So while the Sounders pushed up four places it’s more down to Sporting and New York dropping 2 places apiece than anything else.
6. Sporting KC: Minus 2: Is this just one of those games or does it provide an indicator of things to come? Hard to say but it is stunning that 12 of the 18 shots taken by Sporting originated in the kill zone and they came away with no goals scored!. Is it any wonder their overall efficiency took a hit this week. With Colorado coming in this will be a big test; and both Collin and Besler will need to be completely engaged to stop the quick counters that Colorado should offer.
7. New York Red Bulls: Minus 2: Who’da thought? Oddly enough Chivas average more goals a game at home than New York on the road! A complete sleeper statistic that is for me, totally unexpected. See the table below… Even more stunning is that all 7 shots taken by New York were in the kill zone and the guys missing were Espindola and Cahill! If ever a time was needed to come back and take three points it’ll be against DC United at home for the Red Bulls. Chances are their ranking will pick up again next week after deciding to take the week off against Chivas.
| Team | Average of POSSESSION PERCENTAGE | Average of SHOTS TAKEN | Average of SHOTS ON GOAL | Average of GOALS SCORED |
| CUSA HOME | 0.46 | 11.85 | 4.08 | 1.15 |
| NYRB AWAY | 0.48 | 9.86 | 2.93 | 1.14 |
8. LA Galaxy: Plus 5: As noted earlier, Seattle was not the biggest mover this week; that honor belongs to LA and their 1-nil win away to Vancouver. Arena has got to be well pleased with keeping a one goal cushion for over 87 minutes of play. Hard to believe, but if they keep their own house in order the remainder of the season (~95% chance they do) they could finish with at least 58 points. That’s just enough to bypass Real Salt Lake, who would finish on 57 points if they can take their home games. Finally, the Achilles heal for LA has been their defense; the shutout against Vancouver goes over well when considering how far up the ladder they moved this week.
9. FC Dallas: Plus 1: Not sure what to offer here other than there was clear evidence that Dallas simply dominated the game across the pitch against San Jose last weekend – what they failed to do however, was prevent goals against. That’s not an unusual event for Dallas lately and while they did manage to take three points to end a horrendous slide the other week it doesn’t get any easier with Vancouver, Colorado, New York coming up in the early part of September and two of those games are away. By the way, a good reason for a move up in the Rankings simply comes down to this… in the game against San Jose they won:
- The possession battle,
- The passing accuracy battle,
- The shots battle,
- The shots on goal battle,
- They had fewer fouls,
- They had more Corners
With that who’s trending up and down in Attacking the Final Third for the Eastern Conference?
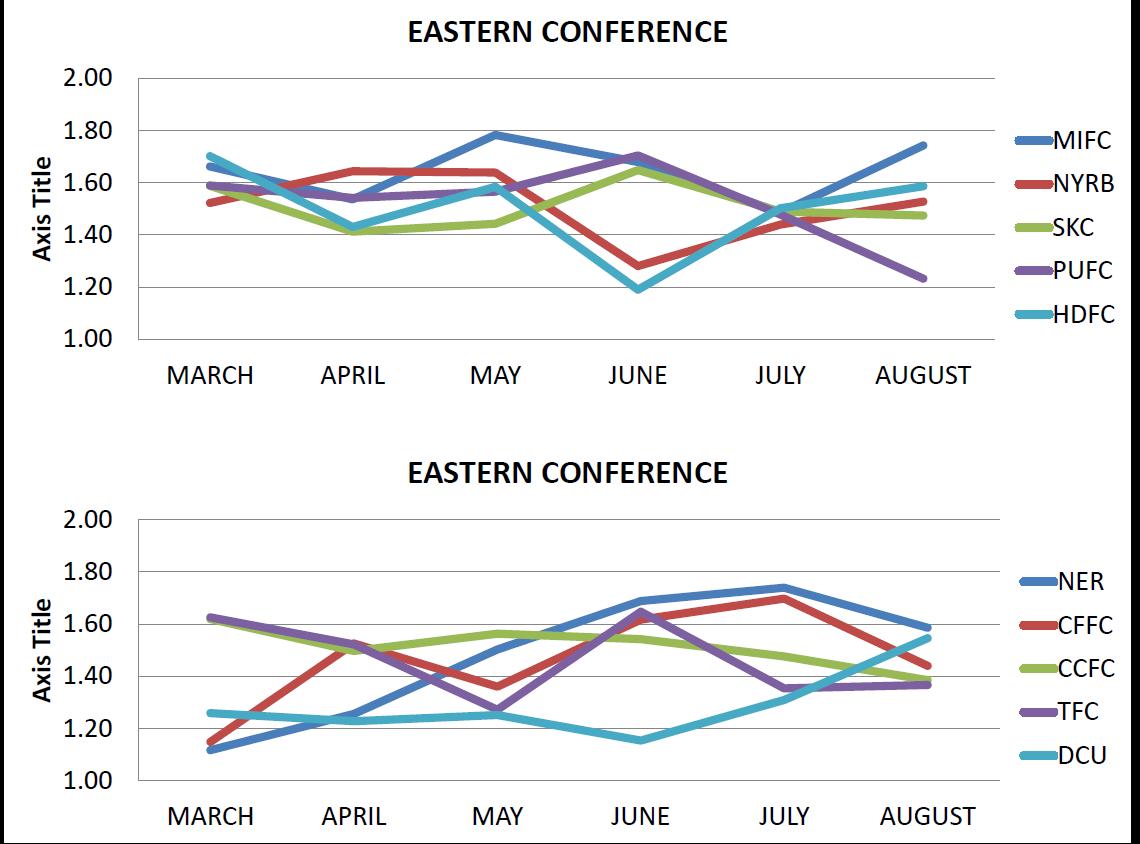
EASTERN CONFERENCE TRENDS IN ATTACKING THE FINAL THIRD BY MONTH
Observations:
It would appear that Philadelphia is trending downwards since June and teams below them are getting closer to them in the league table.
And while that hasn’t impacted their overall position yet the gap between them and:
- Houston is now 2 versus 3
- New England is now 2 versus 5
- Chicago is now 4 versus 8
- Columbus is now increased from 6 to 9
It looks like the changes being made by DC United are beginning to take effect in team efficiency; how that continues to translate to points is the challenge.
But for now they have taken nine points since June; which is considerably more productive than just the five points they took from March to May.
Steady as she goes for both Kansas City and New York as they are starting to recover from the summer heat of June.
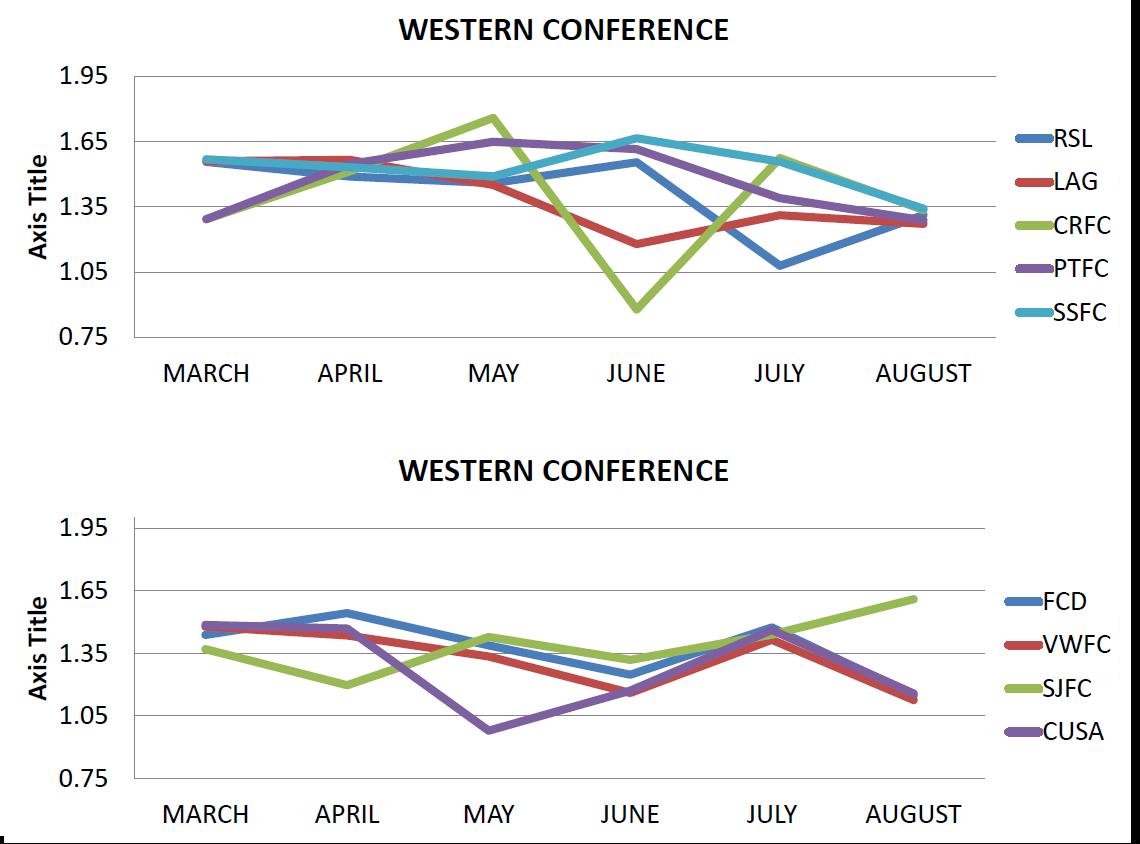
What do the trend show for who’s getting better or worse in Attacking the Final Third for the Western Conference?
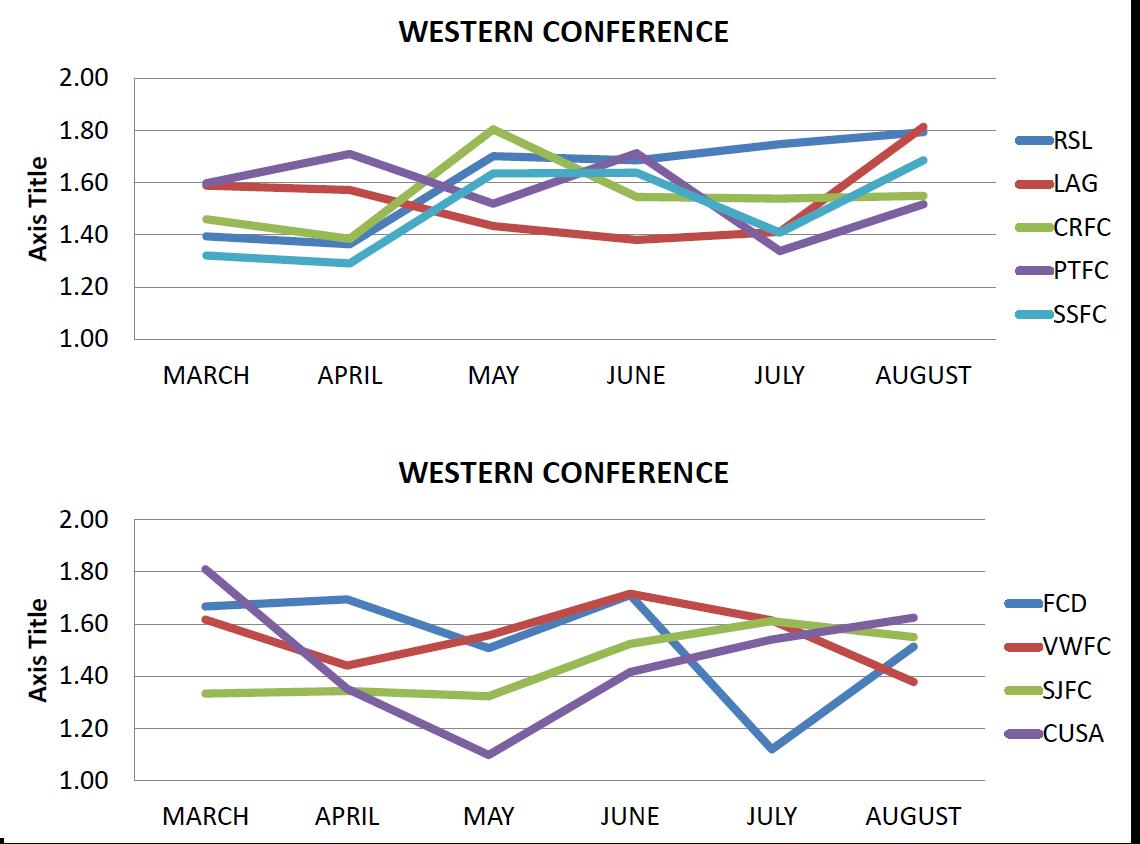
WESTERN CONFERENCE TRENDS IN ATTACKING THE FINAL THIRD BY MONTH
Observations:
RSL just keeps getting better and with those added points their team is becoming even more efficient than May – continuous trend upwards.
Colorado continues to remain steady after that slight drop off in May and there should be little doubt that the red line for LA will continue to get stronger.
As noted in some earlier discussions, the potential slump that Portland had was from June to July and not from July to August.
A team to watch will always be Seattle and they’ve raised the bar in the last month by some margin.
Teams to watch currently out of the top five may be both Dallas and San Jose while Chivas continue to get better under Jose Luis Real.
With that who’s trending up and down in Defending the Final Third for the Eastern Conference?
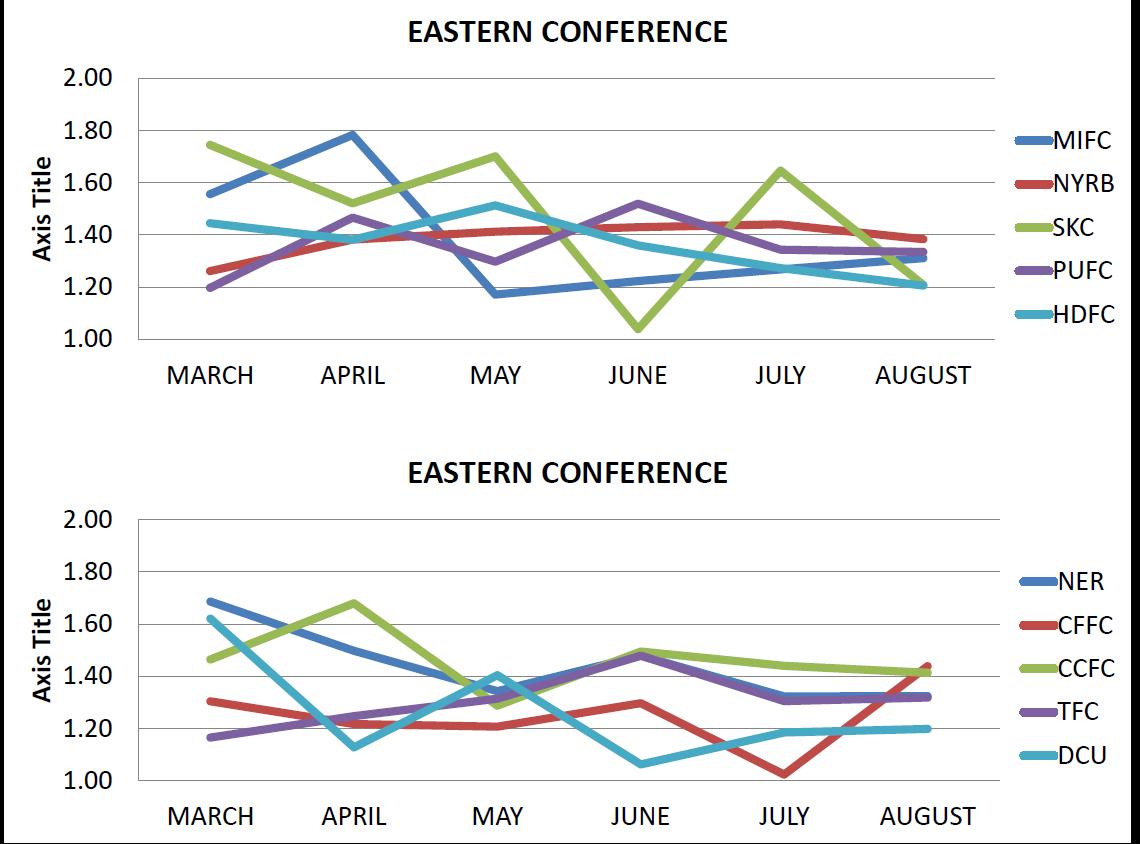
EASTERN CONFERENCE TRENDS IN DEFENDING THE FINAL THIRD BY MONTH
Observations:
Given the World Cup qualifying it’s probably no surprise that Sporting KC took a nose dive in June – with the return of their players that has seemed to help but the lead they had at the end of July (1 point against NY and Montreal and just two points with the Union) has now moved to see them out of first and tied with NY while two points adrift a r
Interesting in seeing the overall decline in defending efficiency from Houston; given their penchant for passing and leading the league in passing efficiency it is surprising to see their continued decline since May of this year.
They remain close, as does Philadelphia but both New England and Chicago are getting better in defending the final third as well as attacking the final third. Could we see the Revolution and Fire displace the Union and Dynamo?
What do the trend show for who’s getting better or worse in Defending the Final Third for the Western Conference?
WESTERN CONFERENCE TRENDS IN DEFENDING THE FINAL THIRD BY MONTH
Observations:
An intriguing observation is the continued downward trend for Portland since May – gone are the runs of clean sheets and in place of them have been some gut wrenching draws and losses from set-pieces.
And if anyone watched their recent game against Seattle it should be pretty clear that Seattle is not the best of defending teams in the final third either.
All told the main team on the move for improving their defending efficiency in the last 3 months has been San Jose.
During that 3 month improvement effort San Jose are still adrift the league leaders by 11 or more (now RSL and not FCD) but they are now just 5 points behind Portland and 3 points behind FC Dallas.
If there ever is a time when a team needs to get better in defense it’s near the pucker time of the playoffs. It will be interesting to see if this trend continues given they still have two games left with LA (both away) plus matches against RSL (away) and Colorado at home; nevermind the season closer with Dallas.
For previous details and additional references on the Attacking and Defending Efficiency Indices and Definitions to build two thirds of the data for this effort click on this link here:
For previous details and additional references on the Power Ranking Category Definitions click this link here:
Next up Match Preview as Timbers travel to Tinto to take on Salt Lake…
Chris Gluck
I have been covering the Portland Timbers and Major League Soccer, as a community blogger/analyst for the Columbian Newspaper, since June, 2012. Since then my involvement in soccer analysis has expanded to include participating in the Regional Emmy Award Winning Soccer City PDX TV Show (Comcast Sports Northwest). My unique analytical approach has been published in Europe and presented at the World Conference on Science and Soccer 2014. I also appear regularly as a co-host on Rose City Soccer Show and the Yellowcarded Podcast. You can find my work on PossessionwithPurpose.com, PTFC Collective and Prost Amerika.