
Possession with Purpose Attacking and Defending Efficiency Index Definitions
The best way for me to describe the logic in creating this Index is to provide an early example of the data used and the ‘math’ to go with it…
Three things —
1. Attacking Efficiency Index Calculation example.
2. Defending Efficiency Index Calculation example.
3. How the empirical data points relate to each other when viewed together…
Background = Here’s a snapshot of the basic excel spreadsheet… you can refer to this when viewing calcs provided below.
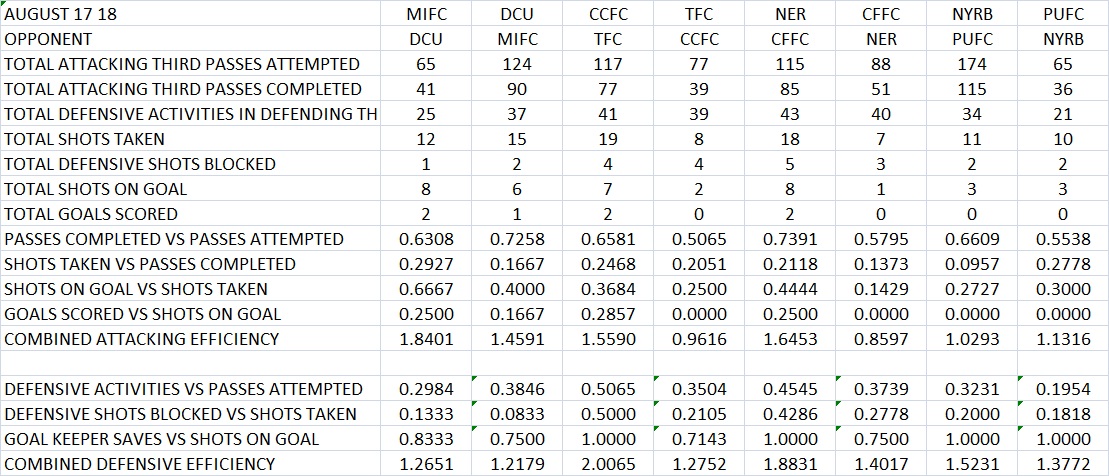
Data Example to provide example for calculating the Possession with Purpose Attacking Efficiency Index
Every single week’s worth of this data is captured through use of the OPTA Chalkboard.
1. The PWP Attacking Efficiency Index calculations for Montreal Impact (17 August) are as follows…
Passes completed vs passes attempted (41/65) = .6308
Shots taken vs passes completed (12/41) = .2927
Shots on goal vs shots taken (8/12) = .6667
Goals scored vs shots on goal (2/8) = .2500
Combined Attacking Efficiency = those four added together = 1.8401
This effort is performed for every team, for every game, this season. A single average is created based upon the compilation of all game Indices to create a ‘to date’ Attacking Efficiency Index.
2. The PWP Defending Efficiency Index calculations for Montreal Impact (17 August) are as follows…
Defensive activities vs opponent passes attempted (37/124) = .2984
Defensive shots blocked vs shots taken (2/15) = .1333
Goal keepers saves vs shots on goal {(6-1)/6} = .8333
Combined Defending Attacking Efficiency = those three added together = 1.2651
Like the Attacking Efficiency Index; every team, for every game, this season has their individual Indices averaged to create a single Index, to date.
Here’s a snapshot of what all the data looks like after being rolled together and then ‘averaged’…
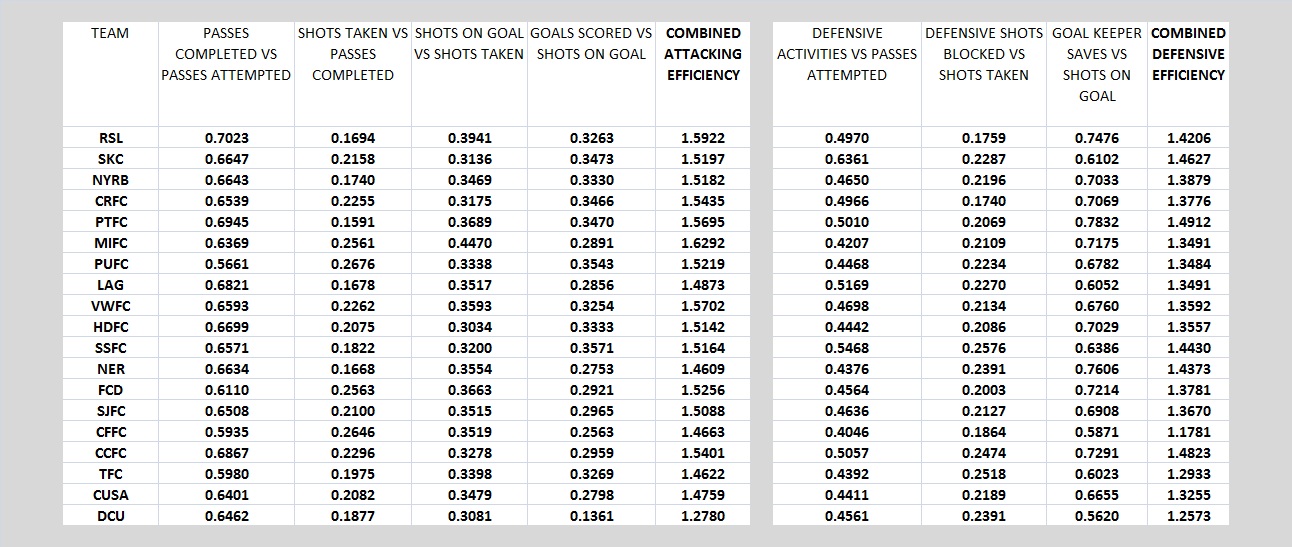
Consolidated PWP Attacking and Defending Efficiency Index Data
3. How the empirical data relates to the data points when viewed together…
Here’s a snapshot of that information to reinforce the empirical relationship between the data points…
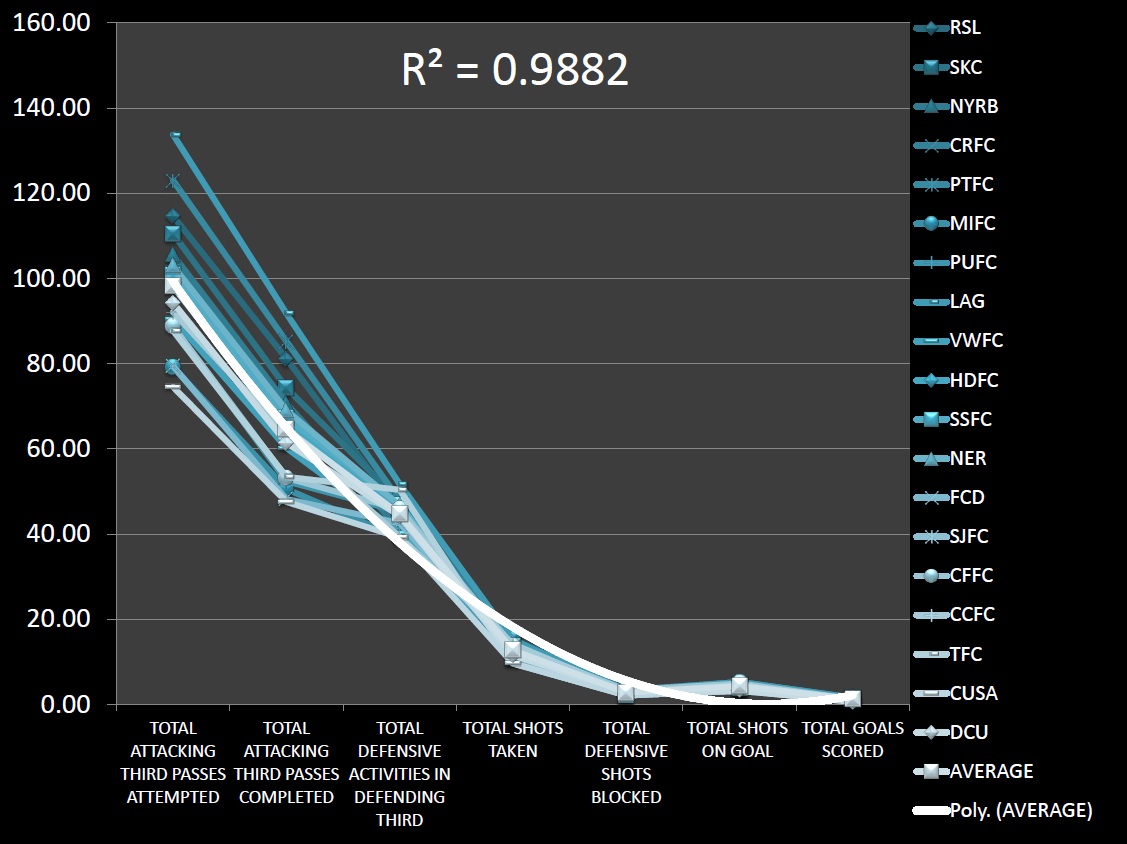
POSSESSION WITH PURPOSE ATTACKING AND DEFENDING EFFICIENCY INDEX BASELINE DATA
Bottom line for me is that the data collected and used to create these Indices has relevance and value with respect to how teams execute attacking and defending in the final third of the pitch.
In addition, when the data points are viewed in line format the R2 is extremely strong; hovering higher than .98xx when using a polynomial regression.
Chris Gluck
I have been covering the Portland Timbers and Major League Soccer, as a community blogger/analyst for the Columbian Newspaper, since June, 2012. Since then my involvement in soccer analysis has expanded to include participating in the Regional Emmy Award Winning Soccer City PDX TV Show (Comcast Sports Northwest). My unique analytical approach has been published in Europe and presented at the World Conference on Science and Soccer 2014. I also appear regularly as a co-host on Rose City Soccer Show and the Yellowcarded Podcast. You can find my work on PossessionwithPurpose.com, PTFC Collective and Prost Amerika.