
OPTA Data – Possession – Key Passes – Recoveries – Possession with Purpose and The Attacking Third – Attacking and Defending Efficiency Indecis
An article written by Richard Farley didn’t prompt this work but it did reinforce work I have already been doing with respect to OPTA; in case you missed it this is Richard Farley’s offering here. Another guy, earlier this year, in the Chelsea SB Nation Blog, also ripped OPTA on “time of possession”…
Back in August of last year I started my research on “possession with purpose” and published my article, in February of this year, noting that OPTA did not track “time of possession” relative to “actual time”.
OPTA track it versus the “percentage of passes” made by each team through the course of “time” that the ball is on the pitch. I have also recently elaborated on that as a guest on the American Soccer Analysis Podcast.
In short, I agree with this approach as it best represents the ‘concept of control’ relative to ‘taking steps to win the game’ – the end-result…
In Richard’s article Simon Banoub (OPTA) responded with…
“One of the main issues we’ve found with the chess clock approach is that it is very, very difficult to implement without putting a dedicated man on it – this is simply unrealistic. Don’t be fooled into thinking that the “chess clock” figures you see quoted are accurate – it is likely that they are hugely flawed. We’ve tried it.”
For me, I have also tried it and I also find it flawed – not because of the time invested to do it but because it really doesn’t provide reasonable and relative information that will have bearing on the outcome of a game.
The main thrust of any game is to possess the ball, penetrate the attacking third and score (while looking to prevent the opponent from doing the same thing).
Movement in and around the midfield is critical but at times is nothing more than a ‘to and fro’ battle where ‘possession changes’ all the time.
For some teams they can bypass the midfield battle and look to go direct, some teams look to capture, counter and go forward while others are willing to ‘cede’ possession in order to get the opponent out of shape.
Others may simply not have the talent to battle the opponent in the midfield while others have the talent in the midfield but draw back because they are away, or… others look to dominate the midfield in order to find / create weaknesses in the defense as they poke and prod the top half of the attacking third.
However viewed, there is quite a bit of strategy and tactical energy occurring in the midfield and it’s not the physical time that drives success in getting into the attacking third it is the ‘passing and dribbling’ that does that.
If anything, OPTA should look to equate some portion of ‘dribbling’ into the ‘possession statistic’ – but since OPTA have the best and brightest already working for them they have no doubt already started to do that.
What is more disturbing to me about OPTA is the lack of consistency in data tracking and their definitions of terms versus play on the pitch.
In that same response by Simon Banoub, to Farley, included a link to OPTA definitions… it’s here as provided – note that the link does not work – it takes you to a site not found? Instead, here is the correct link…
So let’s review what OPTA says about some of their data points…
Key Pass
OPTA definition: The final pass or pass-cum-shot leading to the recipient of the ball having an attempt at goal without scoring.
My analysis – NOT TRUE –
1. Every shot taken must have had a pass involved that created that opportunity to take that shot – therefore every shot taken should have a corresponding ‘key pass’ unless the shot came from a direct turnover. So if a team has 20 shots taken their should be 20 key passes… simple really.
2. Every ball delivered into the danger area that is ‘cleared by the defense’ before a shot is attempted is a ‘key pass’. Why? Because “IF” that ball is not cleared it is likely a shot taken would have occurred.
3. NOTE: On occasion a team will make a ‘key pass’ that IS NOT included in the ‘successful passes’ distribution analysis. See this link first… note that there are ‘two’ key passes in this freeze frame.
4. Now look at this freeze frame – note that the “key pass” box has now been ticked and that there are now “6” key passes not “two”…
5. It should be noted that those additional ‘key passes’ added to the frame come from 4 crosses – why isn’t a cross considered a ‘successful pass’ to begin with; or is it? So you know; here is the link to that same frame with “Successful crosses ticked’ note that the number is 5 but yet the number of successful passes made has not increased by 5?!?
Recovery
OPTA defintion: This is where a player wins back the ball when it has gone loose or where the ball has been played directly to him.
My Analysis – Ambiguous.
1. A ball that has gone loose or where the ball has been played directly to him is not a recovery; it is an unsuccessful pass – this is a double count of data and should be deleted as a valid statistical data point on the defensive end of the pitch. An unsuccessful pass automatically categorizes a ‘change in possession’ so no need to double count it…
Now on to the Attacking and Defending Efficiency Index…
First off though a point should be made here that should have some interest to statistical types… Golazo Passing into the attacking third statistics do not match those from OPTA…
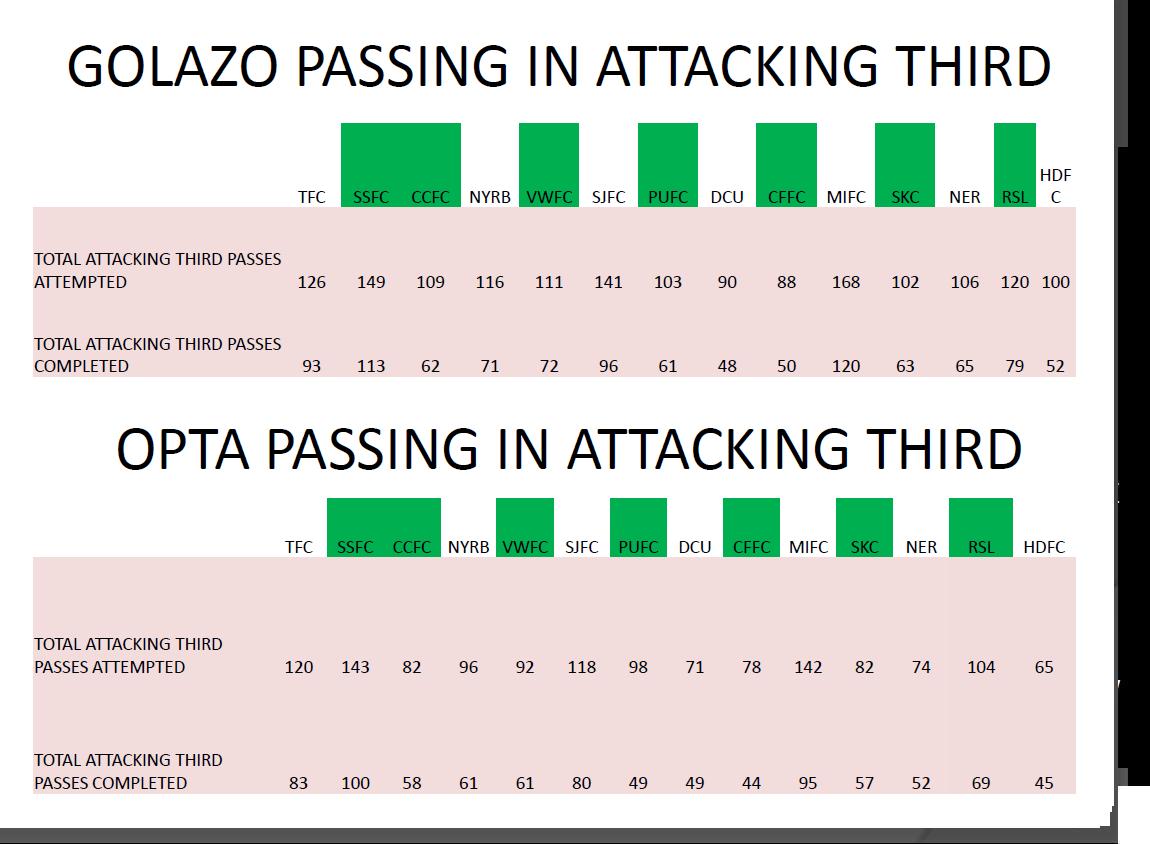
GOLAZO AND OPTA PASSING IN ATTACKING THIRD
To confirm… here is the OPTA snapshot so you can see I am filtering at the appropriate point to capture attacking third data… (69 of 104)
Here is the data from Golazo… FINAL THIRD PASSES (79 of 120)
So, as duly noted, in every game the data outputs from the two data providers is different!?!?
Possession with Purpose Attacking Third – for the purpose of this anlaysis I have deleted ‘recoveries’ from ‘total defensive activities in the defending third because I see them as ‘double counting’ an unsuccessful pass’…
Note also that I do not count ‘tackles lost’ (because the opponent retains the ball) and I do not count ‘corners conceded’ (because, again, the opponent retains the ball).
In addition, Defensive blocks are counted separately and inserted between Shots taken and Shots on goal to accurately reflect that a defensive block is associated with a ‘shot blocked’. OPTA count this twice, once in the ‘Shots’ area and once in the ‘Defensive’ area.
Diagram 1 below leverages Golazo Passing into the Attacking Third data and then references OPTA data points for Defensive data and MLS stats for shots data.
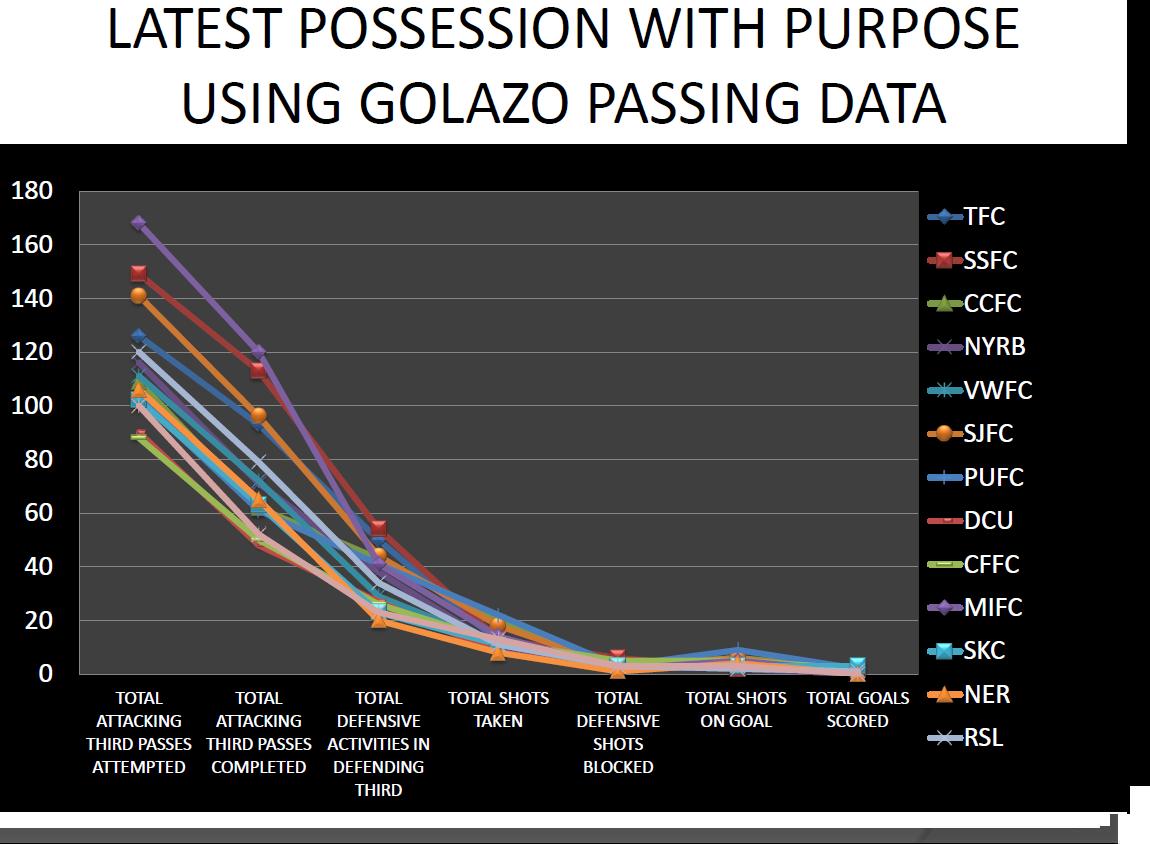
POSSESSION WITH PURPOSE GOLAZO PASSING DATA ENTERING THE ATTACKING THIRD
The Relationship for these data points exceeds an R2 of .75xx for all teams Saturday; it is reasonable to say that the data points provided have a linear relationship to each other working from left to right.
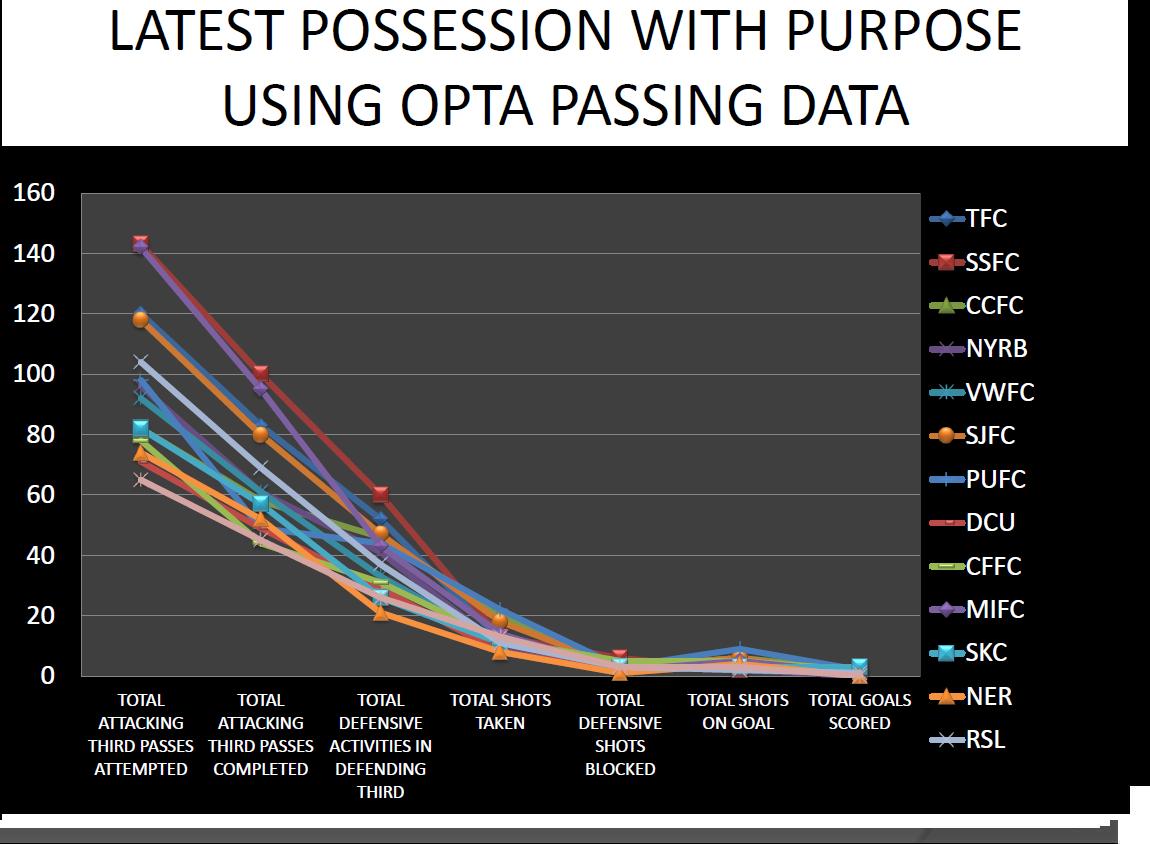
Diagram 2 leverages OPTA Passing in the Attacking Third while using OPTA for the Defensive data and MLS Stats for the shot data.

POSSESSION WITH PURPOSE OPTA PASSING DATA ENTERING THE ATTACKING THIRD
The Relationship for these data points exceeds an R2 of .8xxx for all teams Saturday; it is reasonable to say that the data points provided have a slightly stronger linear relationship to each other working from left to right than using the Golazo Passing data.
For example the R2 for NER in Diagram #1 is .7758 while in Diagram #2 the R2 for NER is .8088.
Therefore, for me it would make more sense to rely upon leveraging the OPTA Passing inside the Attacking Third data as opposed to the Golazo Attacking Third passing data.
Finally, with this greater granularity, here’s my initial stab on a long researched topic (Attacking Efficiency Index and a Defending Efficiency Index).
Here are my data points of concern for the Attacking Efficiency Index: 1) Passes completed vs passes attempted, 2) Shots taken vs passes completed, 3) Shots on goal vs shots taken, and 4) Goals scored vs shots on goal. Other passing data in the ‘attacking half, and across the entire length of the pitch, could be added but I see minimal relevance to the intent on using that data with respect to the team trying to attack…
Note below that the teams with green bars are those that won on Saturday and the teams with red bars are those that lost on Saturday…

POSSESSION WITH PURPOSE ATTACKING EFFICIENCY INDEX USING OPTA
Here are my data points of concern for the Defending Efficiency Index: 1) Total Defensive activities minus those noted earlier {tackles lost, shots blocked, corners conceded and recoveries} vs passes attempted by the opponent, 2) defensive shots blocked vs shots taken by the opponent, and 3) Goal keeper saves vs shots on goal by the opponent.
Note in the Diagram below the teams that won have green bars while the teams that lost have red bars.
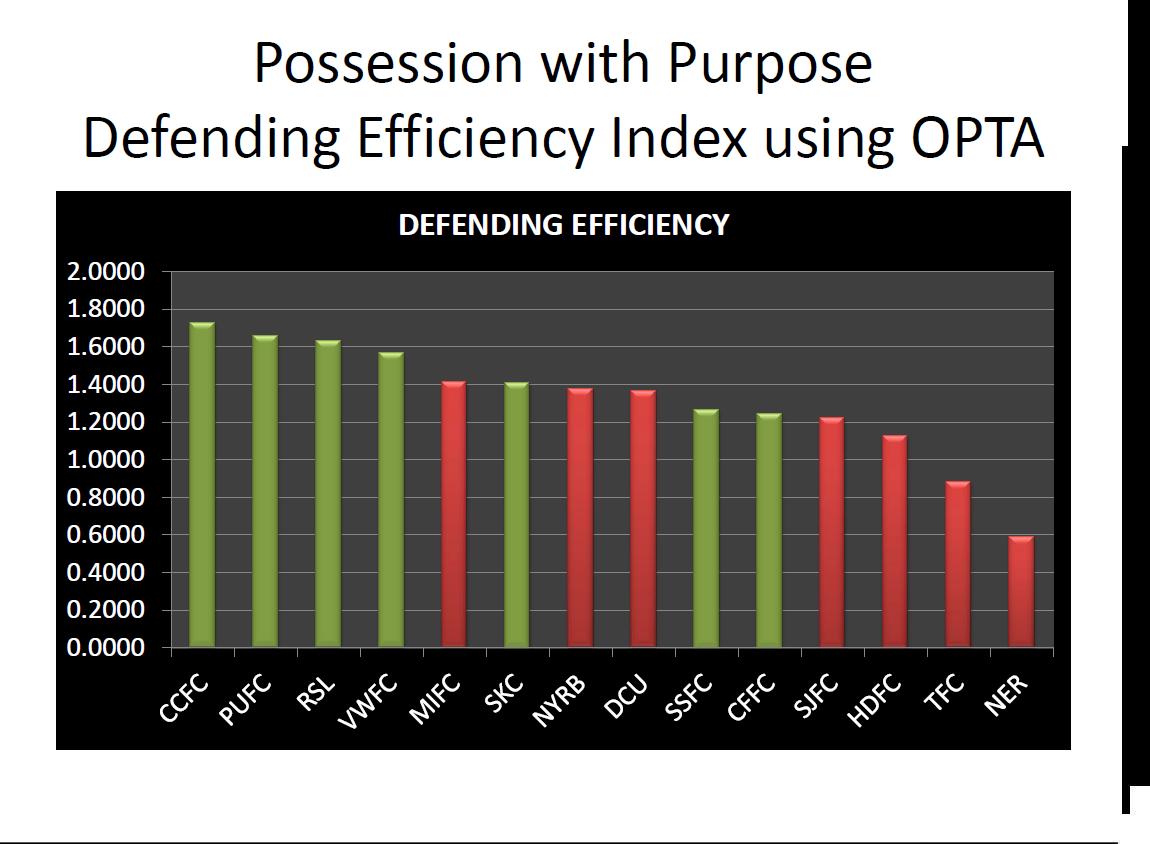
POSSESSION WITH PURPOSE DEFENDING EFFICIENCY INDEX USING OPTA
Observations:
1. It is not surprising to see a team have a higher defensive efficiency index then some other teams that win… as yet, based upon Diagram #1, there hasn’t been a team that lost who had a higher attacking efficiency rating.
2. Given that the data points show a relationship to each other when assessing possession with purpose that should reinforce their strength as the Index fills out with additional games added.
Comments/Thoughts/Perspectives from others are welcomed…
Chris Gluck
I have been covering the Portland Timbers and Major League Soccer, as a community blogger/analyst for the Columbian Newspaper, since June, 2012. Since then my involvement in soccer analysis has expanded to include participating in the Regional Emmy Award Winning Soccer City PDX TV Show (Comcast Sports Northwest). My unique analytical approach has been published in Europe and presented at the World Conference on Science and Soccer 2014. I also appear regularly as a co-host on Rose City Soccer Show and the Yellowcarded Podcast. You can find my work on PossessionwithPurpose.com, PTFC Collective and Prost Amerika.