
Adjusted Possession with Purpose using Passing Attempts as the Kick-off data point

As promised I would offer some additional views on the relationship between Passing data and Total Goals Scored.
Enclosed are two diagrams for your consideration but before getting to them here are the conditions that have been set.
1. The stronger the linear relationship between the data points used to assess overall Possession with Purpose the better. For me it is reasonable to assume that as each step in the possession with purpose phase occurs it will be harder, i.e defense gets tighter the closer you get to goal and the time on the ball to make passes becomes shorter and shorter.
2. Somewhere within the final data stream there should be a way to fold in defensive success in stopping attacks from leading to goals.
3. With that my primary resource for defensive data are the OPTA Chalkboard “Defensive” data points for each team in the game with one particular filter – the only defensive data outputs of concern are those that occur within the defending third; since my focus is towards the attacking third; I could look to the attacking half but the volume of total passes is not supplied by Golazo; if they did I would – for now all they provide is a percentage on accuracy.
4. Here are the Defensive data points within the defending third area collected and added together are 1) Tackles won, 2) Defender Block, 3) Interception, 4) Clearance, 5) Blocked cross, and 6) Recovery.
5. In addition, I have also included, between shots on goal and goals scored, another Defensive data point called Defensive Shots blocked (these are shots blocked by defenders on their way towards goal – these are not the same as Defensive blocks in the defending third.
6. The primary attacking data points include 1) Total passes attacking third, 2) Total passes completed attacking third, 3) Total shots taken, 4) Total shots on goal, and 5) Goals scored. In another diagram I have added in my data collection point (Goal Scoring Opportunities {GSO’s} created).
Diagram #1 (without GSO’s):
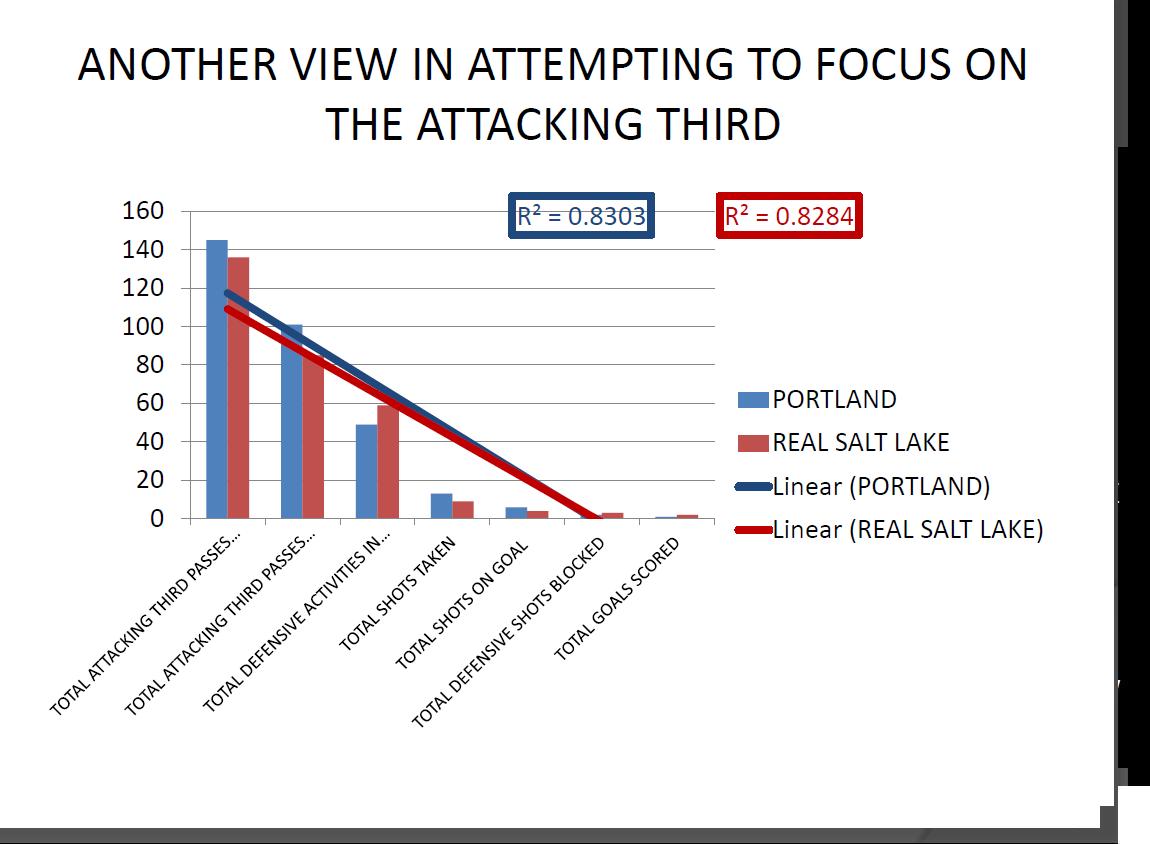
ANOTHER VIEW IN ATTEMPTING TO FOCUS ON THE ATTACKING THIRD THAT INCLUDES DEFENSIVE DATA POINTS
At this stage what I am looking for is an R2 that shows a strong relationship in how the individual data points relate to each other from start to finish – the greater the R2 (closer to “1” – the better the relationship)
Now here’s Diagram #2 (with GSO’s included ‘after’ Defensive Activities and before Shots Taken).
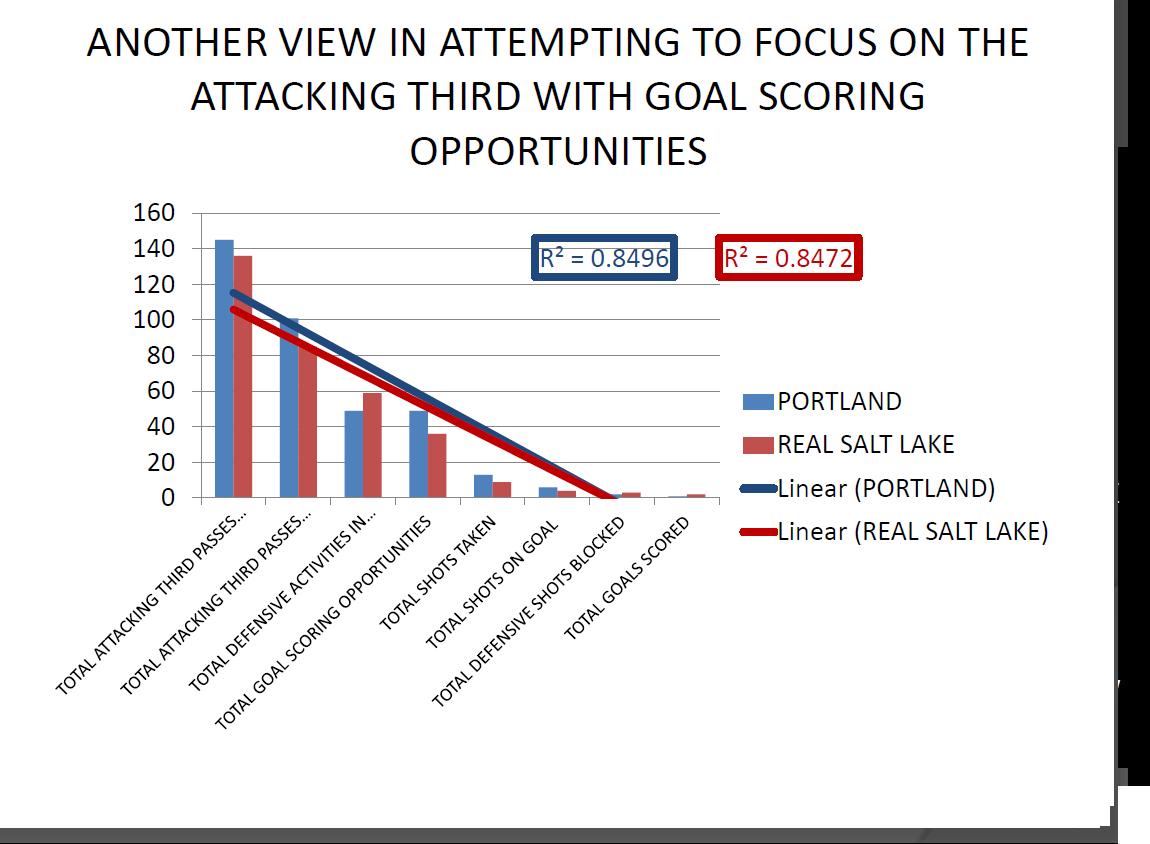
ANOTHER VIEW IN ATTEMPTING TO FOCUS ON THE ATTACKING THIRD THAT INCLUDES DEFENSIVE DATA POINTS AND GOAL SCORING OPPORTUNITIES
1. While the R2 is stronger (closer to “1”) what’s not clear to me (viewing OPTA data) is ‘when’ certain Defensive Activities occur during the course of events that lead to a Shot Taken.
2. Until that becomes clear I will look to stick with Diagram #1 as opposed to Diagram #2; perhaps others have a different view but the final decider for me on this is that all the data provided for Diagram #1 is readily available by Golazo and OPTA (a validated third party source) while, at this time, I remain the only person who attempts to collect and analyze ‘Goal Scoring Opportunities’.
3. If that changes – and I have a suggestion in with Golazo to collect (failed assists) then I will reconsider.
4. For now, through to the end of this year, I will continue to collect my own penetration data and my own GSO’s while also collecting the data points identified in the first Diagram. My hope is that both R2 outputs remain relational.
5. If you want to add your vote to the “failed assists” statistical data pull by Golazo you can vote for it here https://mlsdigital.uservoice.com/forums/206774-golazo-feedback
Late Edit!!!
6. An assumption might be made here that where these is a difference (not accounted for) between Defensive activities and Successful passes is that the attacking team may have recycled the ‘ball’ back out of the attacking third. If that assumption is correct then another assumption might be made that for every Defensive Activity that individually occurs (when added) = the total number of physical penetrations into the attacking third by the opponent.
7. I will look for a way to see how that assumption relates to physical penetrations already collected…
8. In closing on this one – it would appear to me that this type of information (along with some superb data analysis going on with @statsbomb, and others, on striker productivity there remains some reasonable statistical data that can present analysis from ‘cradle to grave’ (from a team and then individual productivity viewpoint); the key for me is having data that is collected by a third party to minimize personal variation/bias…
All for now…
Next up Match Preview – Portland Timbers vs FC Dallas.
Chris Gluck
I have been covering the Portland Timbers and Major League Soccer, as a community blogger/analyst for the Columbian Newspaper, since June, 2012. Since then my involvement in soccer analysis has expanded to include participating in the Regional Emmy Award Winning Soccer City PDX TV Show (Comcast Sports Northwest). My unique analytical approach has been published in Europe and presented at the World Conference on Science and Soccer 2014. I also appear regularly as a co-host on Rose City Soccer Show and the Yellowcarded Podcast. You can find my work on PossessionwithPurpose.com, PTFC Collective and Prost Amerika.