
Does a rise in unemployment equal a rise in theft?
The answer is no, if you do a little digging on the Internet where you’ll find things like this Freakonomics blog post on The New York Times site. The economy, experts say, is not directly correlated to crime and they have numbers to prove it.
This week, though, I stumbled upon some numbers on stolen property that were used in a recent story by reporter Patty Hastings on property theft in Clark County. For the story, I created an iChart displaying which types of property are most frequently reported stolen. When I saw the numbers again this week I couldn’t help but wonder if there were trends underlying things. Where there any outliers, ie, did people steal one type of item more than another in a given year? I created another chart (below).
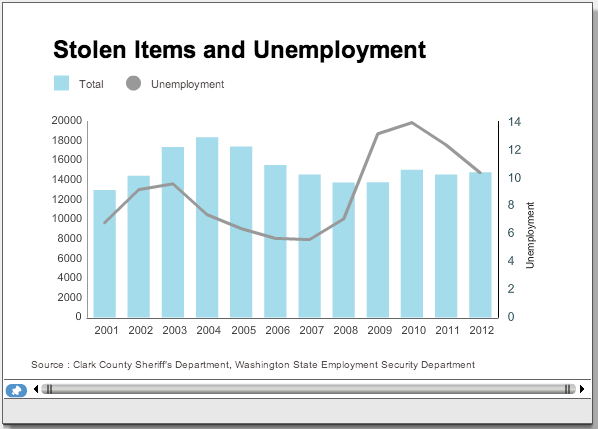
But then I wondered: Did the economy matter in all of this? I then pulled up a look at unemployment numbers for Clark County during the same time span, and things get interesting if you overlay that on top of a chart showing the totals of stolen items year by year (see image below). As you can see, unemployment increased in the early part of the last decade and so did reported property theft. Unemployment then dipped and so did the number of items reported stolen. One might look at that and think the experts aren’t so smart after all. It looks as though the economy does have some sort of correlation with reported theft. Other folks might say that it just shows fewer people are reporting theft perhaps because there are fewer police resources to investigate and recover lost items and/or catch the thieves.
In recent years, however, unemployment increased significantly in the wake of the bursting of the mortgage bubble and the massive recession that ensued. Yet, the number of items reported stolen increases only slightly. So much for that correlation between unemployment and reported theft.
Well, almost. If we look at our chart above, showing the reported theft of individual items year by year, we see that there is a bit of a bump in the reported theft of electronics, computers and portable communications.
That had me wondering if anything else increased, so I created yet another chart of the reported stolen items but removed the figures for total, other and electronics to zoom in on the categories with smaller numbers. In this chart (image below), we see the trend lines for many of the categories flatten or even decrease, except for the reported theft of ID, documents and records (can you say “identity theft?”), jewelry (pawn shops anyone?) as well as drugs and alcohol and weapons.
What do you think: Does a poor economy mean higher crime, or just certain types of crime? Or maybe we shouldn’t believe too strongly in any of this. Perhaps Dodger announcer Vin Scully said it best when he said: “Statistics are much like a drunk uses a lamppost: for support, not illumination.”
John Hill
John is the web and photo editor at The Columbian, where he has worked since 1995 in various roles. A journalist for the past 25 years, he's a fan of good storytelling, data, graphics and still likes to read an actual newspaper. Twitter: @hilljohng