
Toronto FC – Seeing red…
Over the course of the last few years Toronto has done quite a bit (invested HUGE $$) to put a team on the pitch that can challenge others in MLS.
Without blinking an eye this year they’ve sunk deep into their pockets to pull this team out from the red…
The’ye added many new players so far to include Jackson Goncalves, Jordan Hamilton, Doneil Henry, Chris Konopka, Justin Morrow as well as other guys you may have heard mentioned elsewhere like De Rosario, Gilberto, Bradley and Defoe. Somehow I don’t feel they are done.
Almost a complete makeover for Ryan Nelson to lead and one where, if he fails, he is likely to get the sack!
So how far into the depths of dispair did they fall and how big is the hole they need to dig themselves out of compared to other top performing Eastern Conference teams last year?
To begin here’s a look at some team performance indicators from the likes of New York, Sporting KC and New England as a comparison for Toronto…
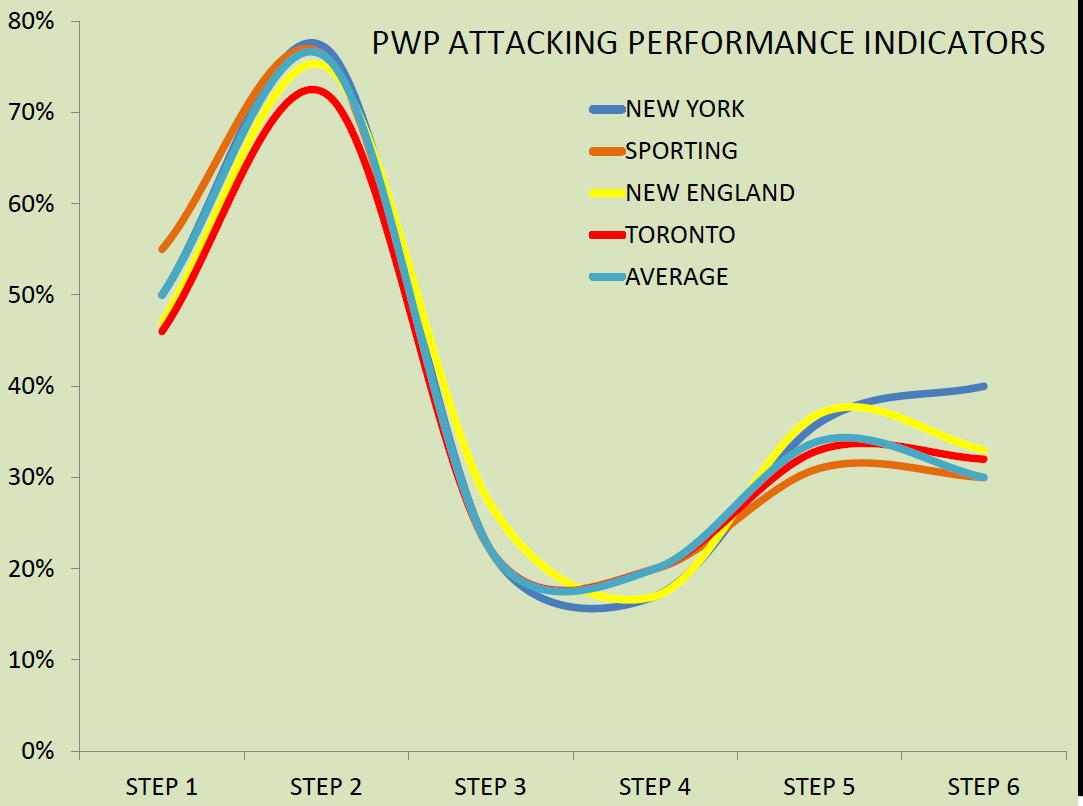
PWP Attacking Index Performance Indicators Comparison
As a reminder here are the Strategic Process Steps:
- Gain possession of the ball,
- Retain possession and move the ball,
- Penetrate & create goal scoring opportunities,
- Take shots when provided goal scoring opportunities,
- Put those shots taken on goal,
- Score the goal.
While the differences between Toronto, red curve, and the other team curves do not appear to be that great don’t forget that Toronto took just 29 Points compared to the other 3 taking over 50 Points.
In addition, when looking at Goals Scored versus Goals Against they were tied for 2nd worst in Goals Scored at 30.
In evaluating the differences the most compelling percentage gap is Passing Accuracy; Toronto had 72% – compared to a team like Sporting who had 76% Passing Accuracy. Again, not much, but when viewed in a larger scale Toronto completed just 8530 passes out of 11632 attempted while Sporting completed 10661 passes versus 13816 attempted.
So a 4% difference in passing accuracy not only reflects poor skills in executing a fundamental step in soccer it also screams on how low the volume of passes Toronto made (and completed) against a Playoff bound team.
All told here’s where Toronto compared to the other three teams…
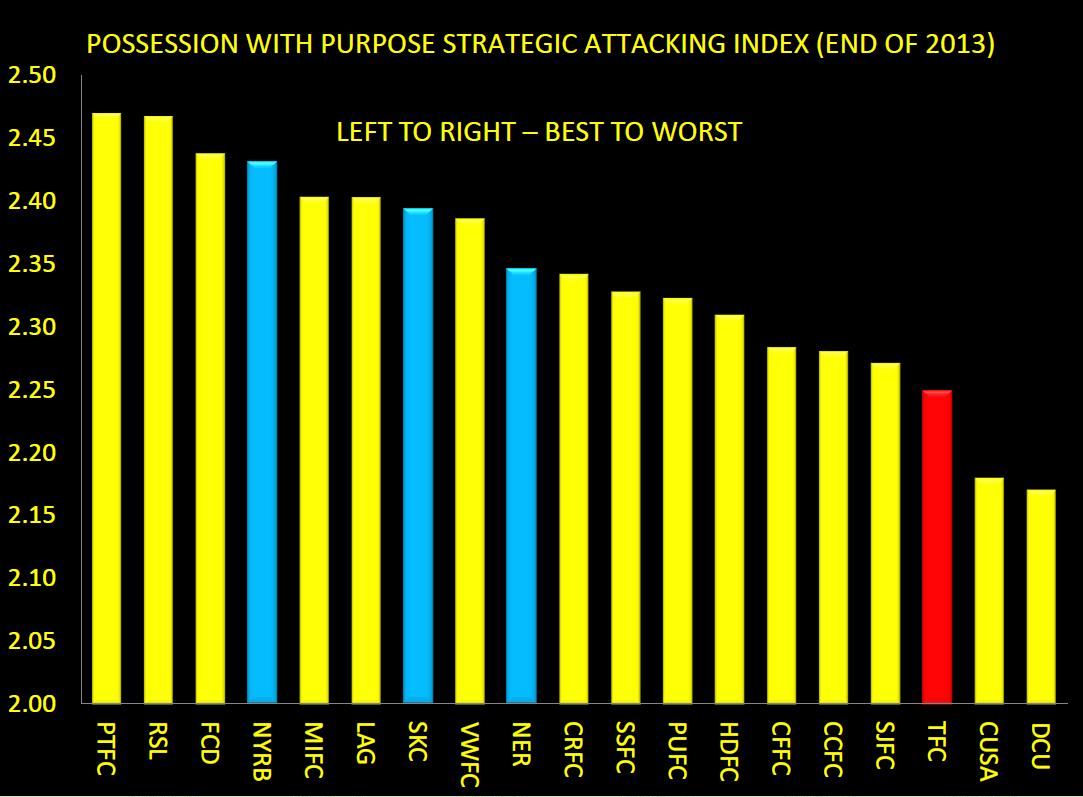
PWP Attacking Performance Indicators Index Comparison
That’s a huge gap to close so with the addition of Bradley, Defoe and others most would expect productivity to increase significantly next season.
So how did things work out on the defensive side of the pitch?
Toronto were just as bad defensively as they were in attack; finishing 4th lowest in the PWP Defending Index with a net Goal Differential of -17.
Here’s a diagram showing the defensive differences between Toronto and other Eastern Conference Playoff teams:

PWP Defending Index Performance Indicators
And now how they compared from a different viewpoint:
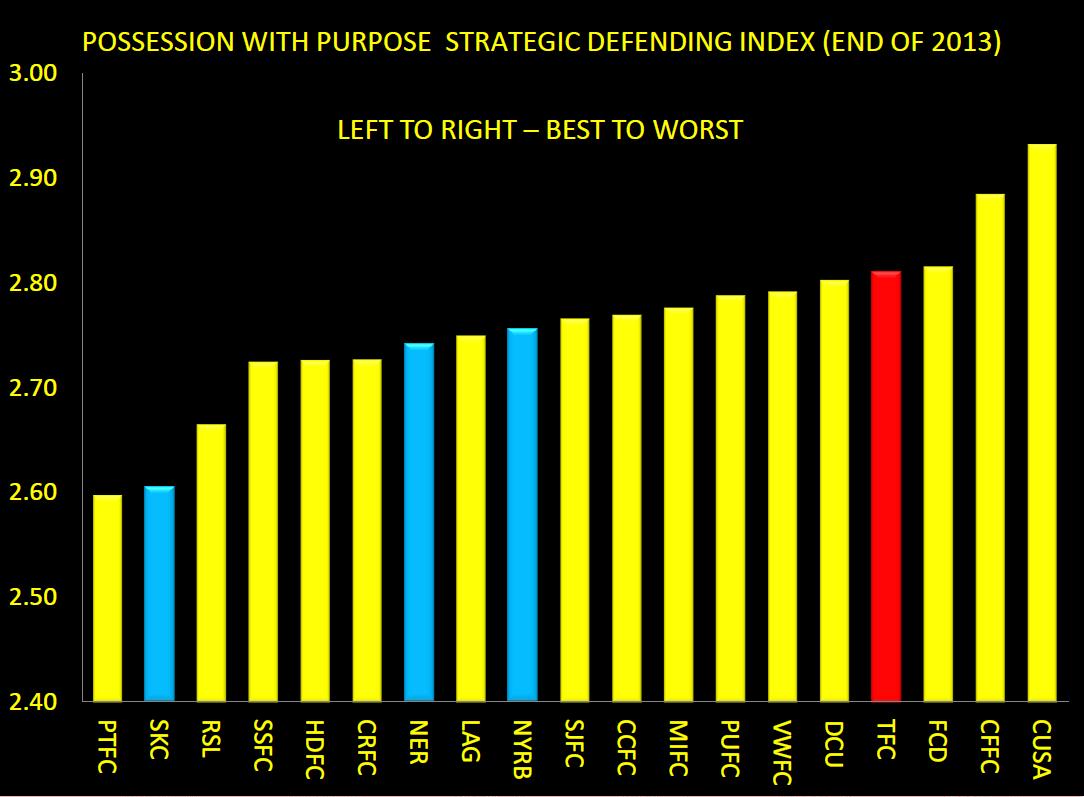
PWP Defending Performance Indicators Comparison Index
The big gap appears to be between Sporting and Toronto; the major differences come from the volume of possession, in particular the percentage of passes the opponents completed in each teams Defending Third; 18.5% for Sporting versus 22.3% for Toronto.
Opponents for Sporting completed 70 fewer passes per game while also attempting 70 fewer passes per game; sheer volume of the attack against Toronto hammered them and to make things more worse the number of defensive activities (tackles, interceptions, etc…) averaged 11 fewer per game than Sporting.
All told that volume of activity ended up with Toronto facing 4.2 shots on goal per game versus Sporting, who faced just under 3 shots on goal.
Success or failure versus Eastern Conference counterparts?
For last year Toronto took 27 out of a possible 75 points with 24 Goals Scored and 31 Goals Against; they only took 4 points from three teams last year; DC United (7 points), Montreal (4 points), and New England (4 points).
At BMO Field they took 18 of their 27 points; only winning 4 of 14 games!
Bottom line at the bottom:
Toronto have much to prove on the pitch this next season with Ryan Nelson having a renewed squad to bring success in Ontario; with the investment made the Reds have again dug deep with the expectation that buying a team = creating a winning team.
Of all the teams next year the one with the most to prove is Toronto!
Next up LA Galaxy…
If you need to better understand my Index and all that goes with it please check out the original posting at American Soccer Analysis:
You can follow me on twitter: https://twitter.com/ChrisGluckPTFC
Chris Gluck
I have been covering the Portland Timbers and Major League Soccer, as a community blogger/analyst for the Columbian Newspaper, since June, 2012. Since then my involvement in soccer analysis has expanded to include participating in the Regional Emmy Award Winning Soccer City PDX TV Show (Comcast Sports Northwest). My unique analytical approach has been published in Europe and presented at the World Conference on Science and Soccer 2014. I also appear regularly as a co-host on Rose City Soccer Show and the Yellowcarded Podcast. You can find my work on PossessionwithPurpose.com, PTFC Collective and Prost Amerika.