
Portland Timbers 1 – San Jose 1
Curved Air – an apt title for me to describe this game and the controlled panic of balls played in the air (especially the last 30 minutes).
The phrase (name) is not original though – it comes from a pioneering progressive rock band in the 70’s, clicking the link will take you to their wikipedia site.
But before I digress into some nostalgia and a few reasons why I feel it is an apt title I sense it is worthy to kick off this article by honoring Diego Valeri and the nifty touches by his teammates leading to his goal…
At 57’31” Michael Harrington offered a throw-in to Rodney Wallace down the left wing in the San Jose defending 1/3rd. A return pass to Michael, with space, allowed him to offer up a cross that was cleared by Attakora; one of their 35 clearances.
It didn’t travel far before Chara got his head to it. It fell nicely to Harrington, who then passed it on to Wallace (with some nifty touches), who in turn laid it off to Will Johnson. From there Harrington got another touch before passing it off to Chara who then fed Valeri who dropped it back to Nagbe.
From there a great through-ball to Ryan Johnson who prepared to shoot… a deflection occurred before the shot and it slipped nicely into the path of Valeri who calmly slotted it home at 57’59”.
For me this one, like the other 20 pass goal two weeks ago, belongs in the Timber-Taka video vault. Why? Well, for me, this is a great example of the short, concise, passing and one touch football (in a confined space) that Caleb Porter has been working towards; the more of these mini-videos in the vault the more confidence this team will have as the season progresses.
So with that said it’s time for some gritty details without looking at the end-result (1 point and an unbeaten streak on the road still intact).
This game was not as described by Jimmy Conrad – ‘controlled for long stretches by Portland’! I would offer that it was the other way around and here’s some compelling evidence for you to consider in why I feel that way…
Possession With Purpose… Two critical pieces to understanding PWP are Penetrations into the ‘red-zone’ (Attacking third) and the creation of Goal Scoring Opportunities. To magnify the differences between the two teams this game I submit this diagram highlighting how those statistical data points played out in 15 minute intervals Sunday night.
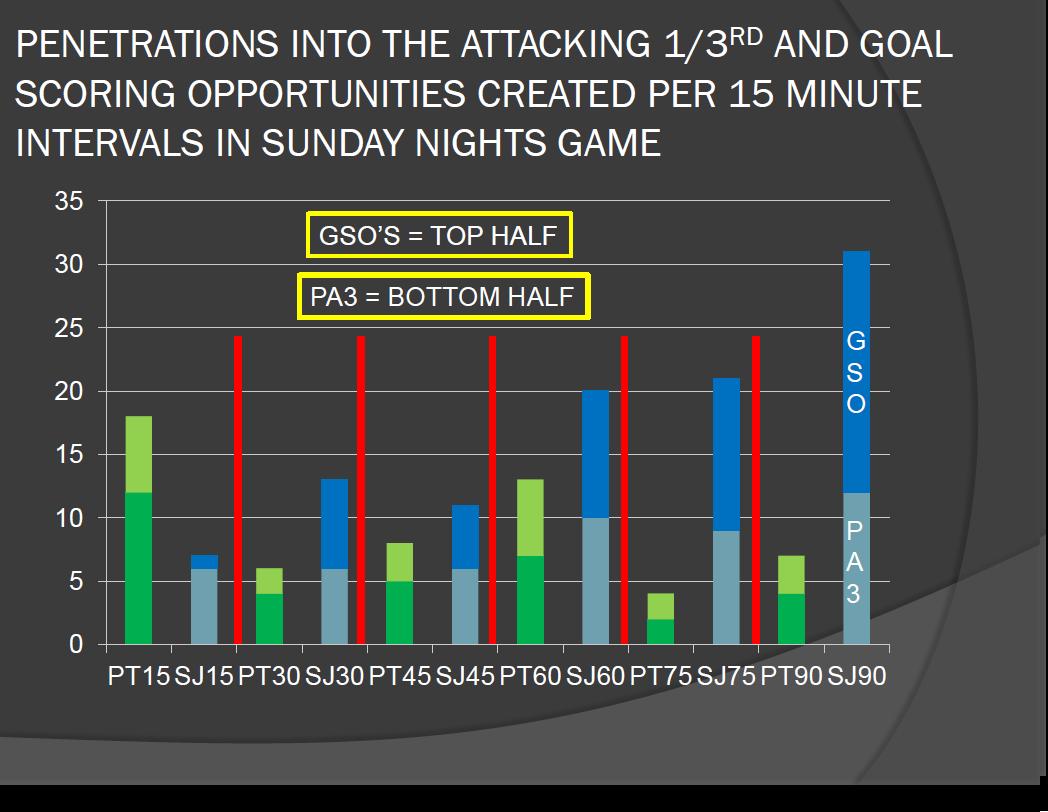
PA3 and GSO for PTFC and SJFC
In viewing the diagram the dark green bars represent PTFC PA3, the light green bars represent PTFC GSO’s while the light blue bars represent SJFC PA3 and the dark blue bars show SJFC GSO’s.
It’s pretty much obvious that San Jose dominated this game from about the 15 minute point onwards even if 1st Half time of possession was in favor of Portland…
Is there another way to view the data to support how well San Jose controlled this game?
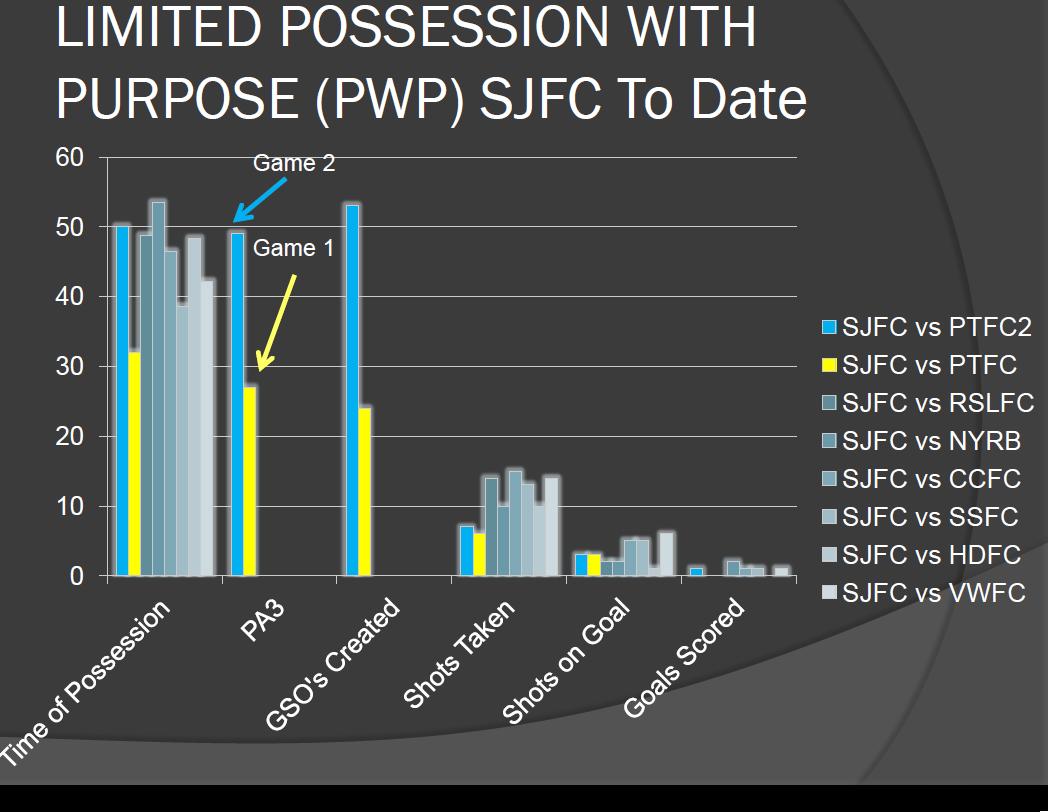
Limited PWP for SJFC to date
Notice the blue bar compared to the yellow bar; Game 1 in Portland represent the attacking statistics for San Jose while the blue bar represent those same attacking statistics for this past Sunday; again – clearly SJFC increased their TOP, nearly doubled their PA3 while doubling their GSO’s.
Another interesting offering here is that San Jose had more GSO’s than PA3; what this means is that when San Jose penetrated the Portland defending third they stayed there and created multiple GSO’s in one visit…
I can recall at least twice in the second half where they had multiple crosses and corner kicks from only one entrance into the red-zone. For me this is another indicator of how well they dominated the game play Sunday night.
And yes, shots taken were near the same but there’s another data point to consider in this when viewing how much pressure San Jose really applied.
But first I beg your patience for a minute to set the stage… there is a statistic in OPTA that I hadn’t really paid attention to before called “Clearances” and when going through some defensive data I popped it onto the screen to have a look… here’s what I saw for Portland clearances in game one compared to game two…
A complete difference – so much so that I decided to check out this statistic in a bit more detail… more later on that but for now here are the raw numbers. In game one PTFC had to clear the ball from their defending half 34 times with 24 of those clearances having to occur in their defending third.
In game 2 (last Sunday) PTFC had to clear the ball from their defending half 57 times with 53 of those clearances having to occur in their defending third. A significant turnaround and a strong indicator on how little Portland really controlled this game even though they ended up with 50% of the possession time.
Another interesting tidbit in looking at that clearance diagram for game two is the pattern on where Portland had to clear the ball; down our left (their right).
To reinforce that pattern here are the trends and tendencies on PA3 for San Jose this game…
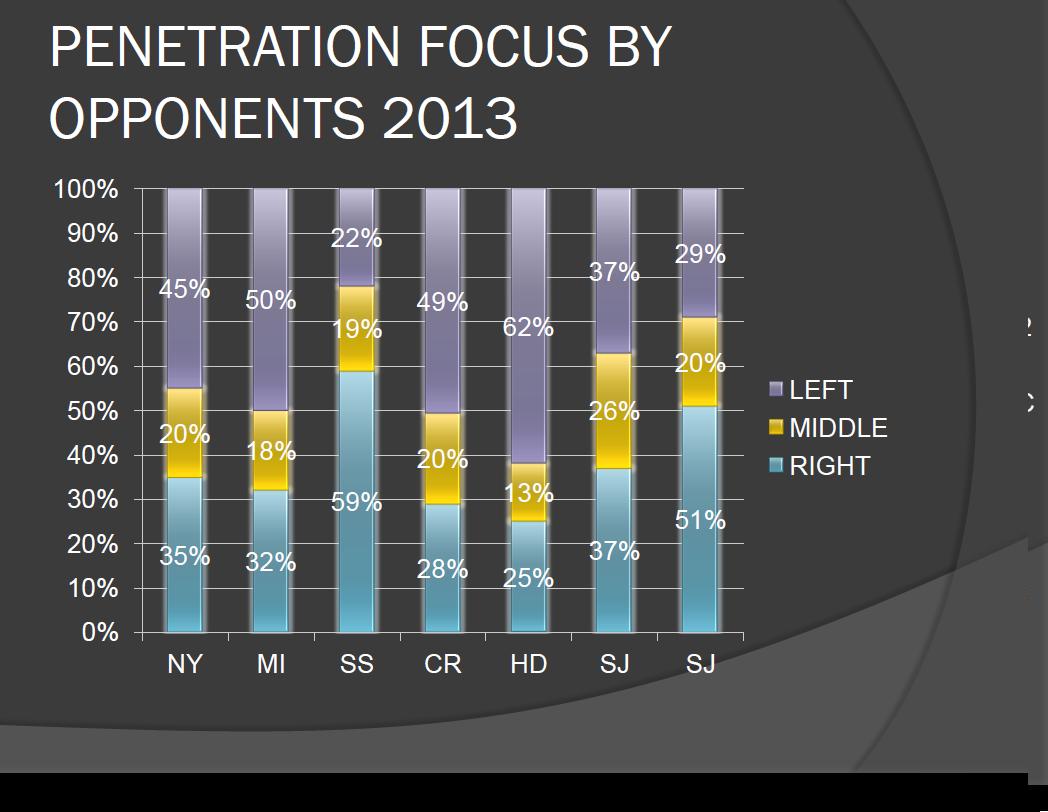
Penetration focus against PTFC to date
Note the last two games against San Jose (SJ) clearly there is a difference in the attack pattern for the Earthquakes and again this data is substantiated by the pattern of clearances.
I did note that San Jose have previously looked to penetrate our left in order to facilitate crosses into the 18 yard box; this additional OPTA diagram should again reinforce the greater volume of crosses attempted into the PTFC 18 yard box from their right (our left)…
San Jose ended up putting in 28 crosses this game while Portland only offered up 10.
Not to kill a dead horse but here’s the latest trend on where PTFC GSO’s were generated… note that again the primary delivery point for San Jose was down our left (their right).
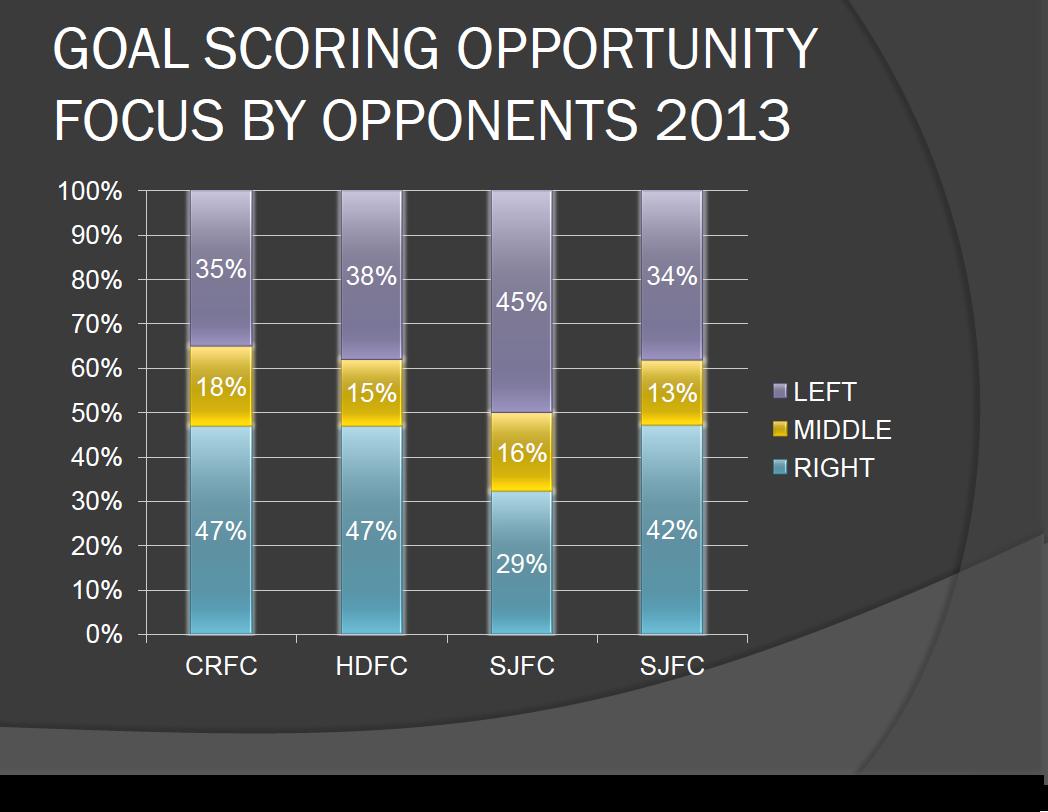
GSO’s to date against Portland Timbers
One other interesting item here is that while San Jose looked to penetrate equally in game 1 while creating more GSO’s down our right they switched focus when playing at home; perhaps we see this same tendency again in July?
With all this change in tactic by San Jose was there any change in approach by Portland compared to game 1?
In the diagram below (and the reason for my theme of Curved Air this game I offer up this info for your consideration…

Curved Air PTFC trends on Headers, Long Balls from Square #1 and Flick-ons
To explain; this diagram is intended to begin to paint a picture of aerial activities in Timbers games this year; the Direct Balls from Square #1 (keeper) do not include those played short – these are only keeper balls that are played long.
Of particular note this game is how Portland doubled their number of long balls from square #1 compared to game one and exceeded all other games earlier this season by a marked total. Headers won in the air were slightly below average and flick-ons won appear on the higher side of the average.
But aerial attacks occur for both teams so how does this diagram compare to our opponents Curved Air?
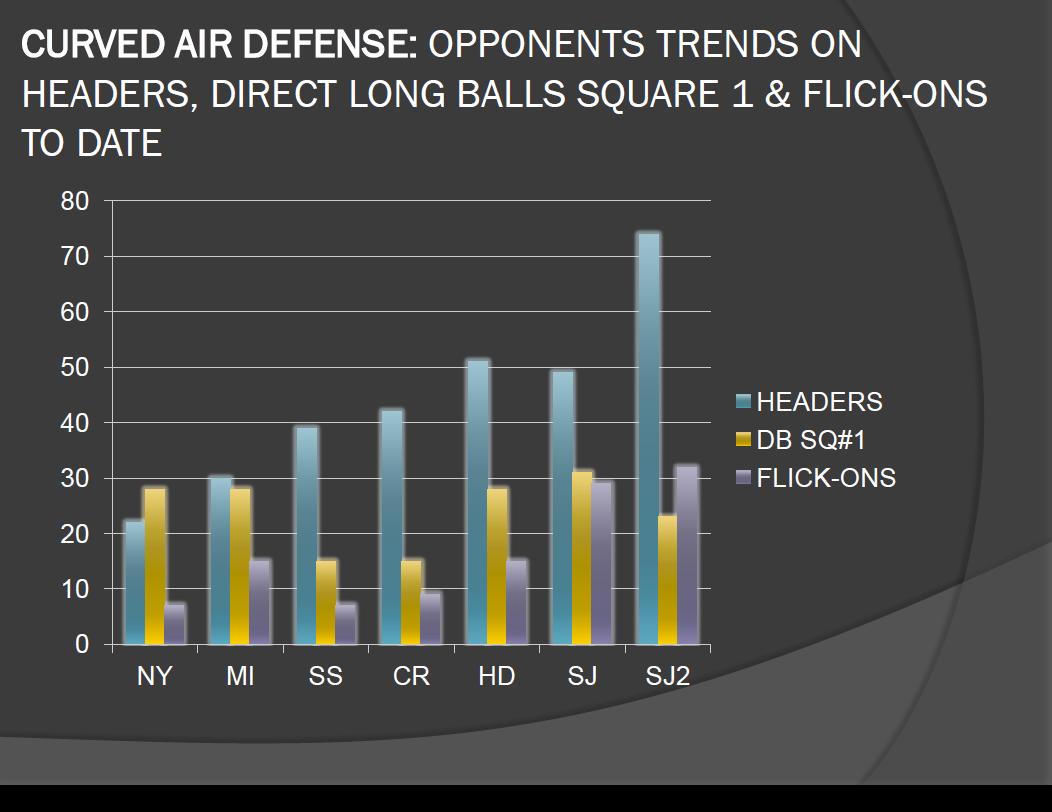
Curved Air Defense – Opponents Headers, Long Balls and Flick-ons to date
A rather unique view here – San Jose completely dominated the curved air this game with 74 headers won and 32 flick-ons won; that’s 44 more headers won and 22 more flick-ons won this game compared to Portland.
Perhaps what is more disturbing is that for the last four games Portland have lost the curved air war on headers and have given up more flick-ons in four out of their first seven games and three on the trot.
I’m not sure what value that tidbit of info provides but it is something I will continue to watch as the season progresses; direct attacking teams leverage curved air; Houston and San Jose are not what I would consider to be possession based teams.
Before closing here’s my overarching diagram on the six data points on Possession with Purpose…
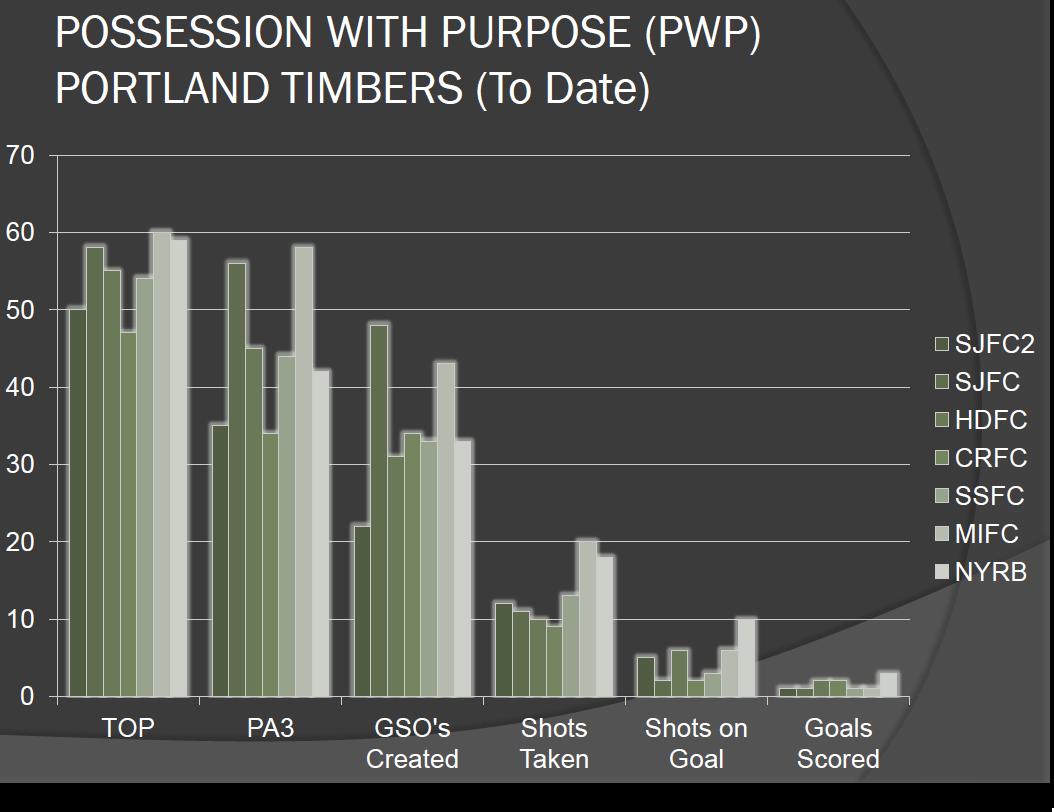
Portland Timbers Possession with Purpose to date
The correlation between the data points remain strong throughout but I hit upon the OPTA statistic (Clearances this week) I wondered what it would look like if I inserted ‘clearances’ into this effort.
My logic in doing this comes down to finding a way to interpret (with available data) what defensive efforts might play in understanding the gap between Goal Scoring Opportunities created and Shots Taken…
Here’s what my PWP now looks like with the seventh data point inserted (Opponent Clearances)…
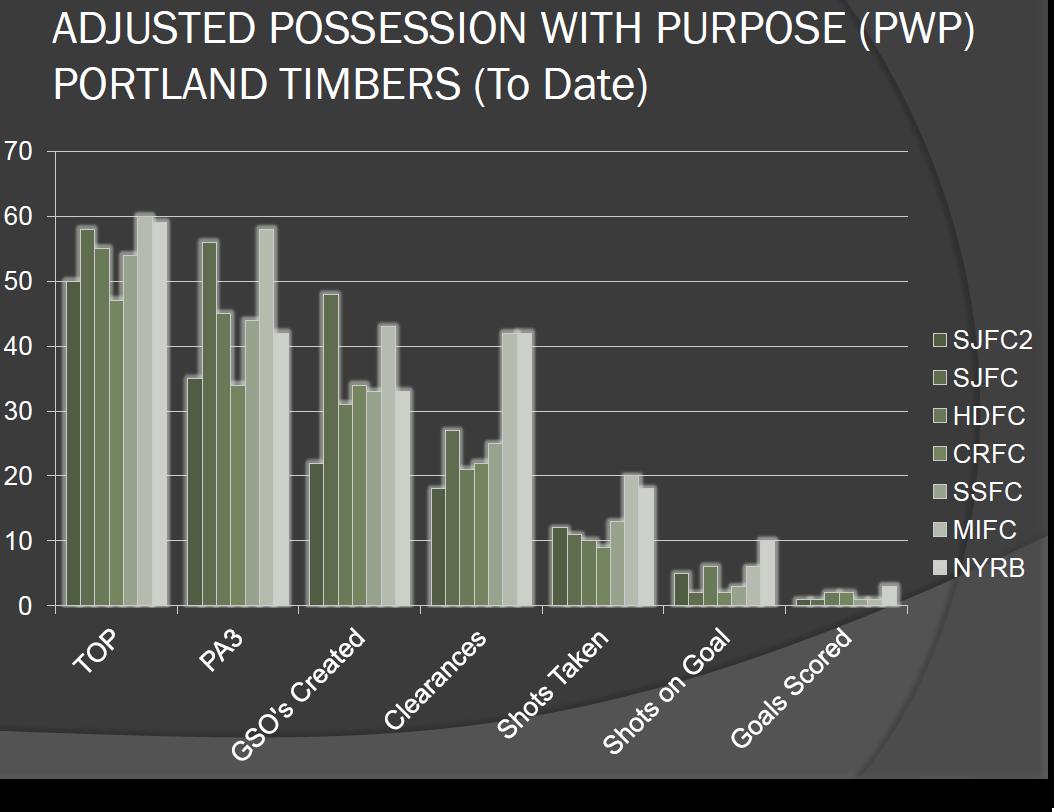
Adjusted PWP for Portland Timbers to date
To clarify – the clearances counted in this come from viewing OPTA data but subtracting out the clearances that occur outside the opponent defending third; this way the focus remains on the ‘red-zone’… (which is PA3)…
In considering this data it looks to me as if this curvelinear relationship is even stronger than before. Aye, there are a couple of points that appear a bit high – will see how those data points flesh out as more game data is added.
If you are curious here is how PWP looks when adding the Opponent data to Portland’s data…

Consolidated PWP data for PTFC and their Opponents to Date
I’ve included a red line to indicate the average of all the data points in this array; again it appears pretty obvious that there continues to be an even stronger relationship between the seven data points…
In closing…
Substitutions:
The eleven players to start this game played their arse’s off and worked bloody hard to maintain some degree of chance to take at least one point; it’s unlucky after having so much luck that San Jose pulled it out at the last minute… I put this loss of three points down to a coaching decision on who substituted for who and not the players themselves…
Alhassan is not defensive minded and probably never will be; he’s a finesse player who likes deft touches and little moves here and there to create space; Zemanski would have suited better in my opinion than Alhassan.
As for Piq, he’s a tall lad but he wasn’t brought into this team to play in the defending third, a more realistic approach would have been to bring on Miller (again for pace and defensive minded thinking) in replacement of Nagbe – another very good player (like Valeri) who tends to be a bit more offensive minded.
A reasonable approach in a late game situation like this would be to inject defensive speed and push the back-four line up higher on the pitch to minimize second chance headers and congestion in the 18 yard box for long goal kicks or long balls from the back-four.
The End Result…
That being said… the players on this team continue to repay the fans… a great result when considering that last year – with the same statistics this organization probably would have lost 3 – nil not drawn 1 – 1.
Very good to great teams find ways to garner points (any points) in games that are ugly and off-style.
Portland stole two points from San Jose in this away game and nearly walked out of there with three.
While there are plenty of games to be played before 27 July that rubber match will be a great one to measure the maturity of both teams as they progress in their different systems of play.
Post Script… In case you are interested one of the best songs created by Curved Air was on their “Air Cut” album… its’ the song entitled Metamorphosis, and like this game in opens and closes with a crescendo of controlled panic (with a piano)… it’s an interesting (ten minute) listen if you can get over the rather unique signing voice.
Next up Match Preview Portland Timbers versus Sporting KC…
Chris Gluck
I have been covering the Portland Timbers and Major League Soccer, as a community blogger/analyst for the Columbian Newspaper, since June, 2012. Since then my involvement in soccer analysis has expanded to include participating in the Regional Emmy Award Winning Soccer City PDX TV Show (Comcast Sports Northwest). My unique analytical approach has been published in Europe and presented at the World Conference on Science and Soccer 2014. I also appear regularly as a co-host on Rose City Soccer Show and the Yellowcarded Podcast. You can find my work on PossessionwithPurpose.com, PTFC Collective and Prost Amerika.