
Trends, Tendencies, and Tidbits about the Timbers to date
Well if you’ve been following the Merritt Paulson series on MLS you should know by now some of the internals behind the scenes.
Here’s the latest by Firchau on Part 2… EDIT – And here’s Firchau on Part 3…
Some interesting tidbits of info to include peeling back some onions on data and how Wilkinson leverages it or has leveraged it in the past.
Paulson also seems to open up the rose petals a bit on the differences between Spencer and himself but I’ll not elaborate too much; the read is worthy and for me codifies much of my approach since climbing on board last year with the Columbian Newspaper last year.
So enough with that, as promised, some trends and tendencies, given the data, for your consideration…
Here’s the overall diagram on Attacking PWP for Portland this year.
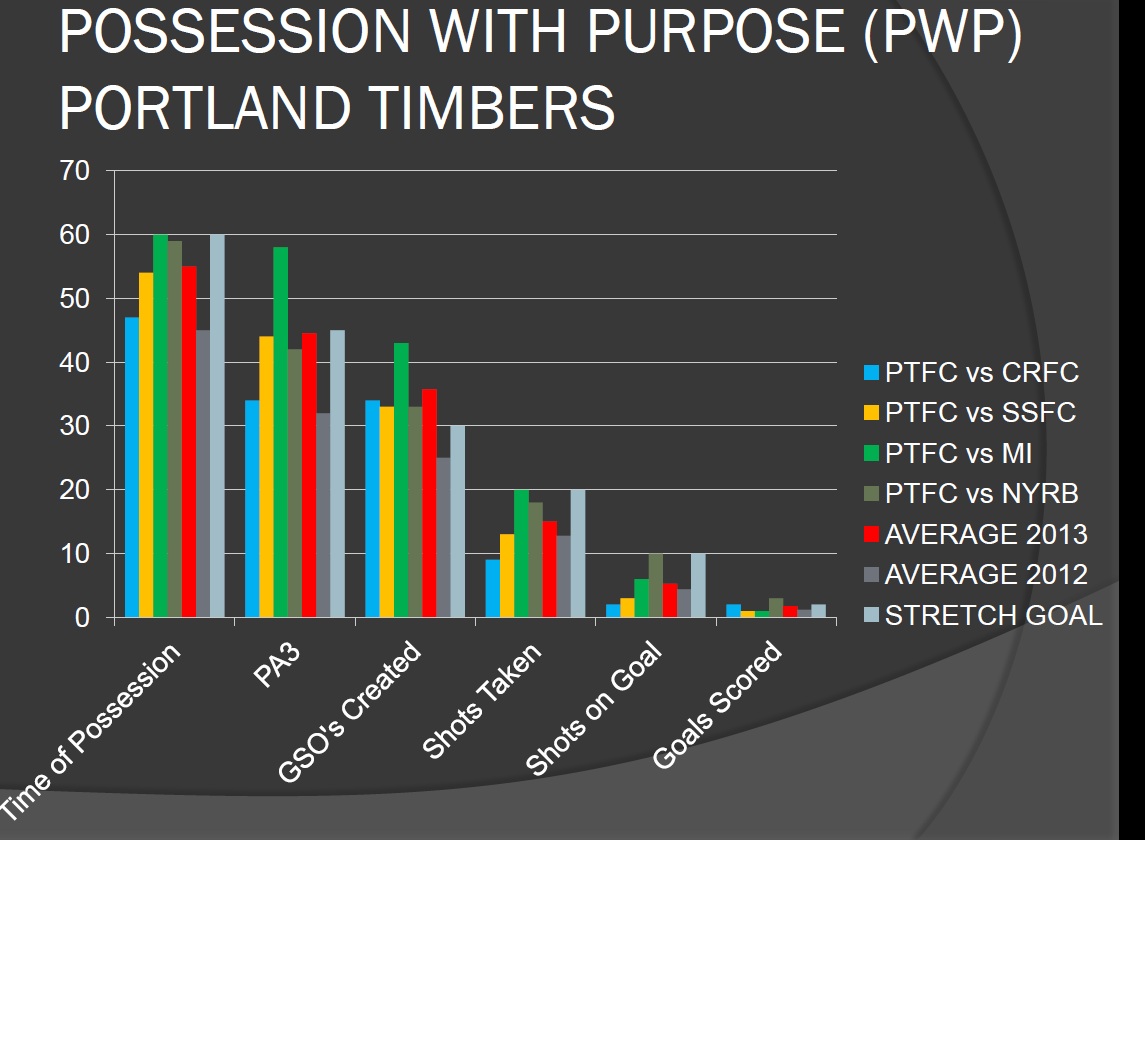
Attacking Possession with Purpose for Portland
In the Portland home games the attacking numbers are pretty intimidating until recalling how many shots from the opponent hit the back of the net and how many points were won (actually lost).
In the Portland away games the attacking numbers aren’t quite as intimidiating but we do know that with tactical changes (reverting to a bog-standard two striker formation) the end state has been (non-negative) with Portland clawing back from being 1 and 2 goals down respectively.
From a statistical relationship standpoint these initial data points continue to show correlation, as long as this remains the case the relevance of the data has some value and goodness.
In the end-state I am hopeful that this team data will provide a good compliment to my previous analysis on individual productivity (that included in-depth analysis on the MLS Castrol Index from last year) as well as the Budgetary Investments (that includes MLS Salaries and goal scoring/assist data) PTFC made in 2012.
I find it intriguing that Wilkinson admits to relying on this similar sort of data during the discussion about Merritt referenced above.
It was that initial data I used as a foundation to offer up what changes (written in October) we might see this off-season; this will provide a very interesting read now that Portland are 4 games into the season…
As for the opponents attacking data; here’s the overall Defending PWP for Portland this year.
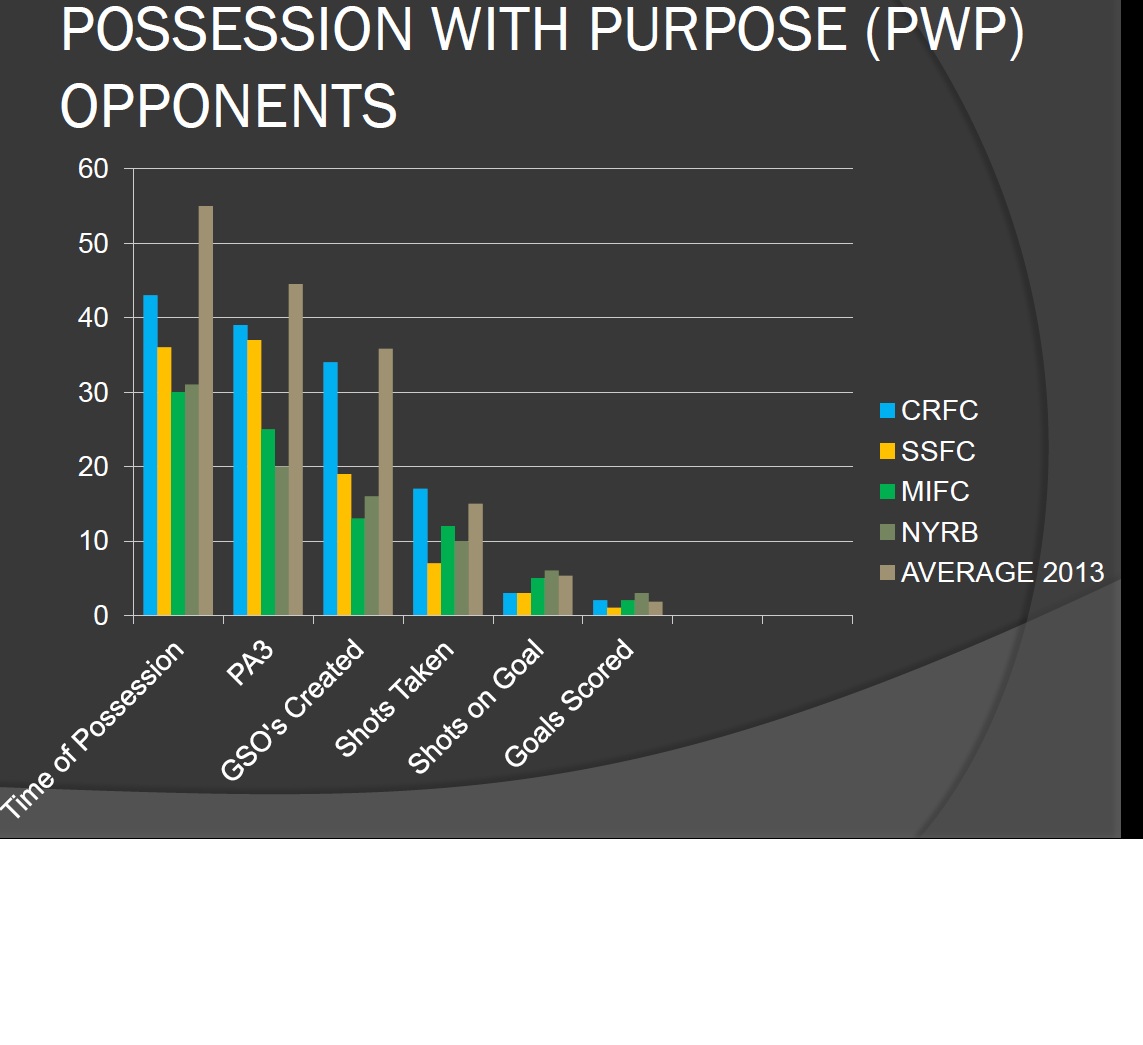
Defending Possession with Purpose for Portland
In considering TOP; the numbers for our opponents in away matches versus home seem to indicate that Portland is not controlling the game as much on the road.
There is an increase in GSO’s by Colorado compared to all other games – whether that was due to weather (wind) or altitude it’s hard to say at this point but for now it’s what I would call an ‘outlier’ in the data set.
For the first time this year the number of opponent penetrations into our red-zone was greater than ours; again perhaps an outlier – hard to say but something to watch for.
For me the real interesting information comes from developing ratios relative to this data; here’s what the ratios look like as each data point is compared to the previous one…
Definition: These are averages based upon four games of data… PA3/TOP; GSO/PA3; ST/GSO; SOG/ST; GS/SOG – for attack – the larger the number the better…
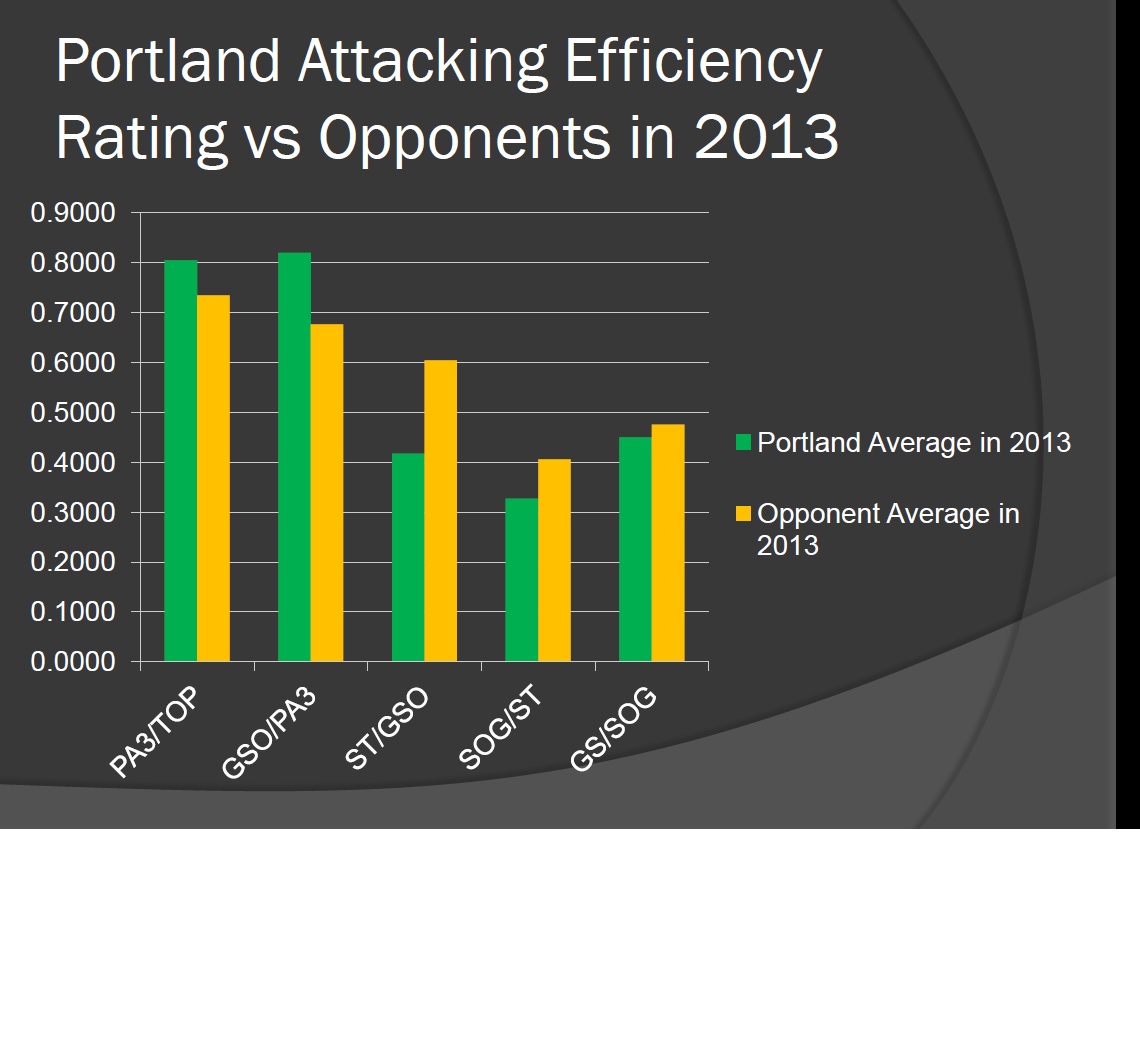
Portland Attacking Efficiency compared to the Opponent Attacking Efficiency
Caleb Porter offered up this year that he wants to maintain and sustain control of the ball. His view (and that of many others) is that the more you control the ball the more likely you are to win games.In viewing the data to date this is not yet the case with Portland.
In terms of Time of Possession, Penetrations by Portland into the opponent red-zone, and the creation of goal scoring opportunities they are succeeding.
In terms of efficiency relative to converting those goal scoring opportunities to shots, shots taken into shots on goal, and goals scored relative to shots on goal the Timbers efficiency leaves much to work on.
Tendencies in Opponent penetrations into our red-zone…

Penetration by Opponents into PTFC “red-zone”
With the exception of Zakuani and Seattle there looks to be a clear trend in where opponents look to penetrate; our left – their right.
There are too many variables on individual performances to offer up thoughts here but maybe this example provides some grist for the mill on areas where teams have delivered crosses successfully and where they haven’t.
This OPTA data is for the game against Colorado. Note no successful crosses delivered from our right defensive side…
This OPTA data is for the game against New York. Note no successful crosses delivered from our right defensive side…
This OPTA data is for the game against Montreal. Note no successful crosses delivered from our right defensive side…
This OPTA data is for the game against Seattle. Only two crosses were successfully delivered from our right defensive side; it’s no wonder – 59% of the red-zone penetrations by the Sounders came down our right. (Zakuani?)
From a defensive standpoint it would appear that both Zemanski and Miller as well as Chara are doing a pretty good job of harrying the attackers on that side…
Or conversely when those crosses go in (usually to the far post) Silvestre and Harrington are doing their job man-marking the target players.
From the other side it might appear that Harrington and Johnson?/Nagbe? are laying off a bit more and allowing crosses into the far right post; and unlike the left side Baptiste and Miller/Zemanski are not doing such a great job in man-marking the target players.
In closing…
For me; this data only represents one tool and it’s my belief that trends and tendencies have value if interpretated appropriately and balanced against gut-instinct or feeling.
The one-track method that data gives you the answer and the only answer is not my view – balance is required so that feelings and gut-instinct can be leveraged (along with data) to reach good decisions.
As an editorial to the Part 2 article by Firchau; it would appear there wasn’t a lot of listening going on… it would also appear that Paulson may have provided Canzano ‘carte-blanche’ to write that article about socializing the idea of sacking John Spencer in May of last year… others may have a different view.
The plot thickens…
Bottom line here is that there remains plenty of time for this season to end in success; early trends in statistics sometimes swing back the other way as time passes.
Lots of pressure on the Timbers – probably more so from Merritt Paulson than the Timbers Army given he admits to following the George Steinbrenner model of team owner…
Next up my Player Evaluations on the Colorado game…
Chris Gluck
I have been covering the Portland Timbers and Major League Soccer, as a community blogger/analyst for the Columbian Newspaper, since June, 2012. Since then my involvement in soccer analysis has expanded to include participating in the Regional Emmy Award Winning Soccer City PDX TV Show (Comcast Sports Northwest). My unique analytical approach has been published in Europe and presented at the World Conference on Science and Soccer 2014. I also appear regularly as a co-host on Rose City Soccer Show and the Yellowcarded Podcast. You can find my work on PossessionwithPurpose.com, PTFC Collective and Prost Amerika.