
Possession With Purpose – The Holy Grail of Soccer Team Statistics?
Possession With Purpose – the search for the holy grail of statistical indices that might have value or goodness in tracking team efficiency in attack and defense.
If you recall my intent at the end of this year was to try and establish an “index” (of sorts) that had more value than the MLS Castrol Index and that the Index created would speak to the ‘team’ and not the individual.
In looking at the past three games I do not have near enough data to fully substantiate a credible offering (statistically speaking I really need 22 games worth of data not 3) on a potential Team Attacking Efficiency Index and Team Defending Efficiency Index but with that said here’s what the data shows today…
An explanation is necessary to show my methodology.
All should be aware I am using MLS data for Goals Scored, Shots on Goal, Shots Taken and Time of Possession (percentage of possession converted to minutes).
What is not provided by anyone (MLS or OPTA) are the number of penetrations into the attacking third (PA3) and the number of goal scoring opportunities created by the team possessing the ball.
To clarify those definitions.
Penetrations into the Attacking Third (PA3) represent a ‘commitment’ by a team to penetrate with the intent to score a goal.
Penetrations are tracked for frequency as well as location.
Possession outside of the attacking third is not necessarily possession with the intent to score; it may be to possess with the intent to possess (rest, waste time, or simply control the ball so the opponent can’t).
It is my belief that when a team penetrates the attacking third they are doing that to score; others may have a different view.
Goal Scoring Opportunities (GSO’s).
Most are familiar with the term ‘assist’… an assist is awarded to a player who created a goal scoring opportunity that a teammate scored from. What is not counted is all the unsuccessful “assists” that occur in a game.
By me counting these I am determining what opportunities a team creates for themselves to score but fail in doing that. Failure can be for any number of reasons, poor delivery, poor timing, great defending, etc…
A GSO may originate from a goalkeeper who delivers a long ball into the attacking third that a forward can get onto and score a goal (we have seen that before), they may also originate from just about anywhere on the pitch provided they are delivered into an area where a teammate ‘has an opportunity’ to get their head or foot on the ball to deliver a shot.
From a more simplified approach a corner kick is always a GSO unless played short and the next ball is not a shot taken.
A Free kick is always a GSO or shot taken unless delivered short and the next ball is not a shot taken.
A throw-in may be a GSO depending upon where it is delivered into the box and what the next action is by the attacking player.
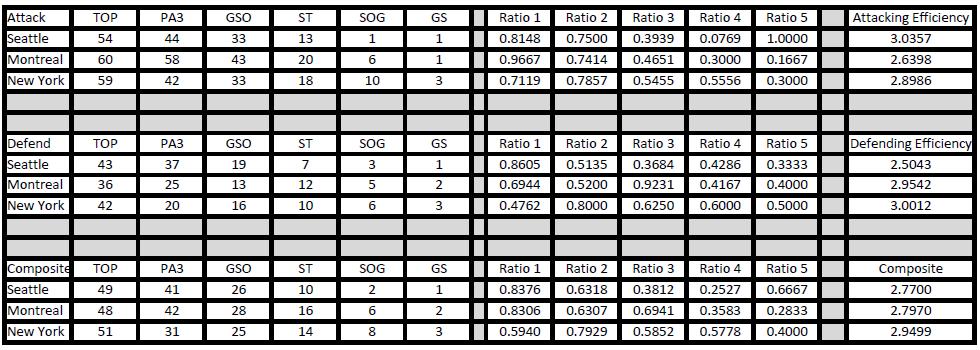
Now onto the calculation approach. In PWP I have six data points, TOP, PA3, GSO, ST, SOG and GS… Here are the initial numbers after 3 games….

Portland Timbers Attacking, Defending and Composite Efficiency Ratios Based on Using PWP Data Collection Points
Click to enlarge.
Conditions:
1. The larger the number for the Attacking Efficiency Ratio the better.
2. The smaller the number for the Defending Efficiency Ratio the better.
3. Ratio 1 (PA3/TOP)
4. Ratio 2 (GSO/PA3)
5. Ratio 3 (ST/GSO)
6. Ratio 4 (SOG/ST)
7. Ratio 5 (GS/SOG)
8. Attacking Efficiency Ratio (Ratio 1 + 2 + 3 + 4 + 5)
9. Defending Efficiency Ratio (Ratio 1 +2 + 3 + 4 + 5)
10. The Composite is an average of the data per game… this may change as I may add ‘weighted factors’ to one or more of the six data collection points… more data will help me determine whether or not I need to weigh things differently. This may also include different weights for home versus away games…
Observations: The (So-What)
1. The general belief after seeing the game against Seattle most felt and thought that Portland had a very good attacking scheme and in comparing the data points between this game and that of New York they did.
2. The general belief after seeing the game against Montreal was that Portland created a number of opportunities but failed to convert; the lower Attacking efficiency number seems to confirm this.
3. The general belief that Portland played a much better defensive game against Seattle than either Montreal or New York appears to be confirmed in that their Defending Efficiency Ratio was lower than either of those games.
4. Enough data is not available at this time to begin to validate the value and goodness of these numbers; I require at least 22 games worth of data to hit a margin of error of 10% with a confidence level of 99%.
5. In looking at the result of each game Portland has two points; the games where they obtained a draw were the two games where they had the largest Attacking Efficiency Ratio.
6. In looking at the games where the opponent scored the fewest goals against Portland they have the lowest Defending Efficiency Ratio (Montreal 2 goals at 2.79 and Seattle at 1 goal 2.77).
7. For me there is value in seeing that the defending efficiency ratio for the game against Montreal was higher than the game against Seattle.
8. Likewise there is value in seeing that the attacking efficiency ratio where Portland scored three goals against New York is higher than the game against Montreal.
9. What this data cannot substantiate yet is the differences between home games and away games; I don’t even know if it will and that is part of the reason why I continue to hesitate in offering it up as something for you to consider.
10. Composite numbers are provided but as yet it remains unclear to me what value they might have without seeing more data.
Call for help if of interest…
I would like to see how this data presents itself with information on PA3 and GSO from across other MLS teams; alas I cannot do all that work myself.
If you are interested and have the time and energy to track PA3 and GSO (by half and by location of penetration and GSO) then contact me through twitter; it would be interesting to see how this data plays out for the entire MLS.
Next Up: My preview of the match between Portland and Colorado…
You can follow me on twitter here
Chris Gluck
I have been covering the Portland Timbers and Major League Soccer, as a community blogger/analyst for the Columbian Newspaper, since June, 2012. Since then my involvement in soccer analysis has expanded to include participating in the Regional Emmy Award Winning Soccer City PDX TV Show (Comcast Sports Northwest). My unique analytical approach has been published in Europe and presented at the World Conference on Science and Soccer 2014. I also appear regularly as a co-host on Rose City Soccer Show and the Yellowcarded Podcast. You can find my work on PossessionwithPurpose.com, PTFC Collective and Prost Amerika.