
What we do for work in Clark County

They say we don’t talk to our neighbors any more but let’s pretend we do, and we know what they do for a living. But do you ever wonder whether what all of those other people in your neighborhood do? Well, we’ve got a couple of maps that might help.
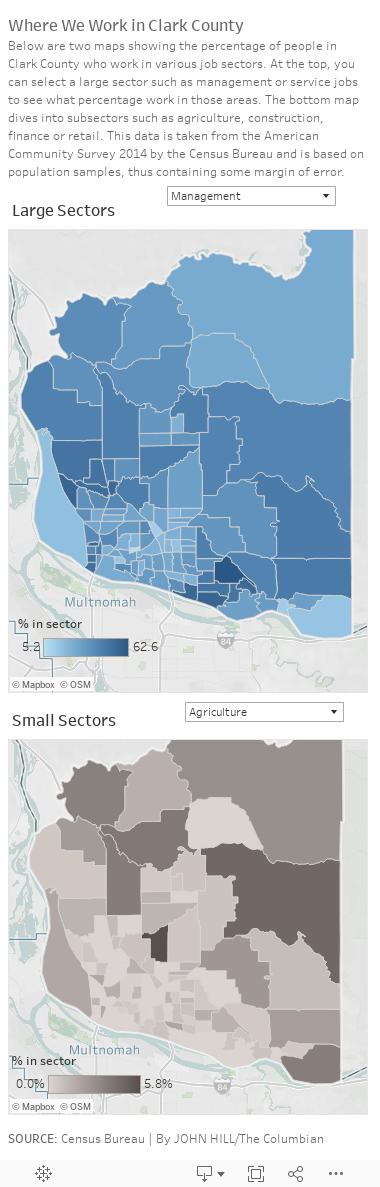
Below you can see two maps that let you drill down and see the percentage of people working different types of jobs by census tract.
The first map provides a look at the bigger sectors: management, natural resources, production, sales and office and service jobs. You can see pockets where the percentage of people in some areas is higher and some lower, i.e., there appears to be more people in management living in east Vancouver and in Camas while the natural resources jobs appear to be, well, up north and to the east where you find more resources. A larger percentage of the service sector appears to live in central Vancouver and near the mall.
The second map drills down further, offering a look at some subsectors such as agriculture, arts and entertainment, construction, education, finance, retail, transportation, wholesale and more.
Obviously, census tracts are pretty big, or can be big and can contain more than one neighborhood, so this doesn’t exactly tell you what everyone in your neighborhood does for a living. But it’s about as close as we can get and still retain some sense of accuracy, though the Census Bureau cautions that even at the tract level all of this data is generated from sampling and has a margin of error. In other words, take it all with a grain of salt.
Still, even though Labor Day came and went on Monday, these maps offer a glimpse into what we do for work in Clark County. See any surprises?
John Hill
John is the web and photo editor at The Columbian, where he has worked since 1995 in various roles. A journalist for the past 25 years, he's a fan of good storytelling, data, graphics and still likes to read an actual newspaper. Twitter: @hilljohng