
Steve Pierce’s Winter Weather Outlook 2013/14 and “BIG” Winter Weather Forecast Conference Next Weekend!

As many of you have seen, several regional and national forecasters have put out their winter outlooks ahead of the 21st annual Winter Weather Forecast Conference next weekend (the 26th) at OMSI in Portland. The public is welcome to attend this free meeting. For more details see: http://ametsoc.org/chapters/oregon. As I have for the last ten years, here is my freshly minted long range forecast outlook for the upcoming winter. This forecast is not a product of any other publication and the information contained herein is the sole thoughts of its author (aka; me). Feel free to share this link with others or cut and paste this information for your own use elsewhere, with credit given.
At first glance, some forecasters predict cold and snowy in the Pacific Northwest while others go for warmer and drier than normal. Hummmm! What is going on here and why is there so much variation in these forecasts? Perhaps the lack of either El Nino or La Nina is accounting for the large variation in forecasts that have been released to date? Before I forget, I would like to thank the National Weather Service, NCEP, CPC, Nate Mantua, Klaus Wolter and NASA for their GREAT data that is used in generating my forecast each year!
So, what do I look at in making my forecast each winter? I look at the following. The first is the latest SST’s (sea surface temperature) departures from normal in the tropical Pacific ocean. As you can see the latest NOAA/NCEP/CPC update shows that we are clearly in the “neutral” zone right now and not likely to exceed the threshold for either La Nina or El Nino in the coming few months. When SST’s warm (El Nino), the Pacific Northwest can experience warmer and drier winter weather on average. The opposite is the case in most La Nina’s (cooler than normal SST’s in the tropics). La Nina and El Nino come and go on a 3-5 year average basis. When SST’s are near normal, this are referred to as “neutral.” Such is the case right now. Each one of these can have a differing impact on Pacific Northwest weather by changing the position of the polar and subtropical jet streams. The resultant outcome is a change in the position of upstream high pressure (ridges) and low pressure (troughs). No, there will NOT be a test on this later. Again, here is the latest SST’s forecast departures from normal for the coming winter and into next year. Simply put, in order to meet El Nino or La Nina thresholds, we would want to see SST’s above +0.5c or below -0.5c for more than five consecutive overlapping months. This is also known as the “running mean.” Click on the image for a larger view —
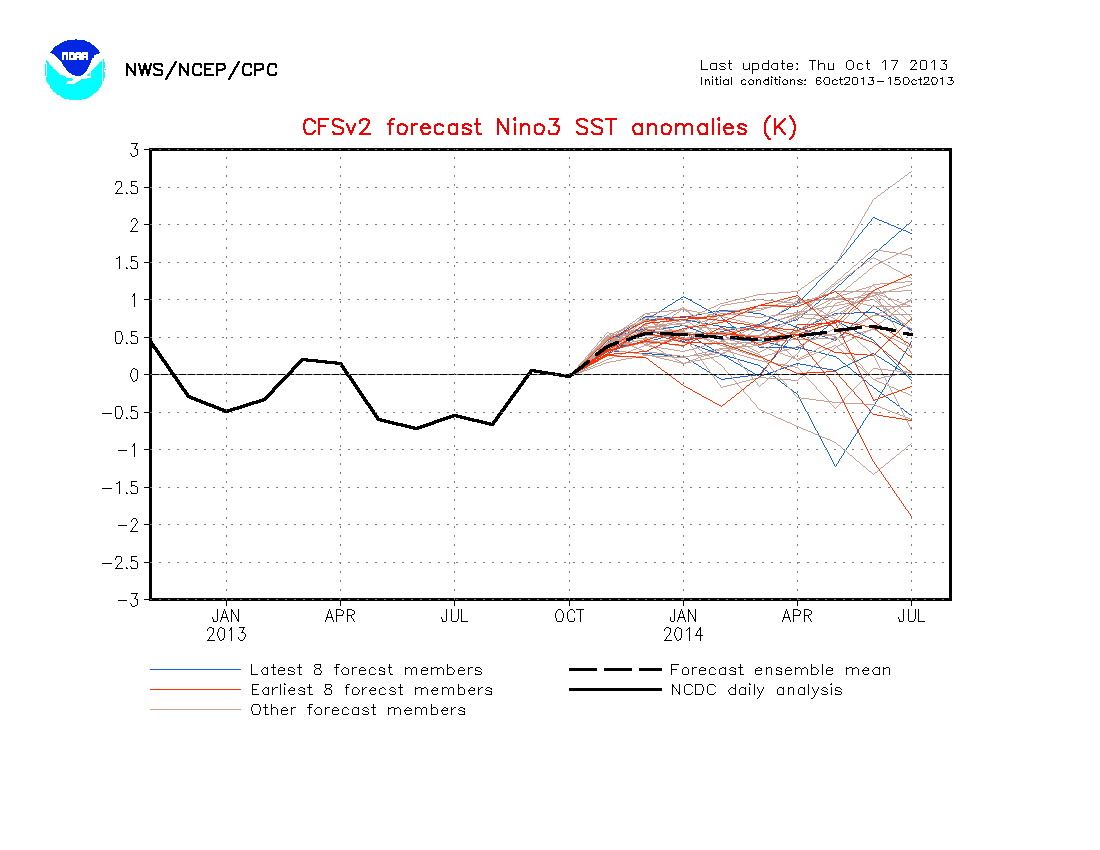
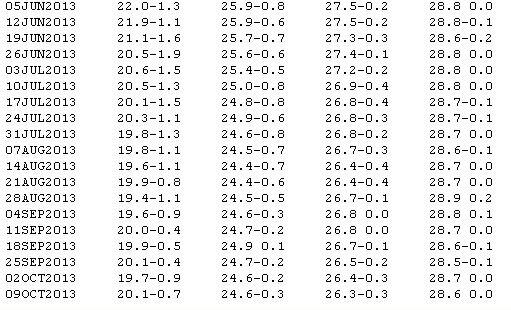
I have noticed that some forecasters are hedging their bets on the idea that we will be nearing the threshold for a potential El Nino event or at least on the warm side of neutral this winter. But herein lies the problem with only using this index. Current SST data is consistent with SST’s being just below zero degrees (c) for the last month. So, at first glace it would appear as though the above forecast temp plot is already showing a warm bias. That solid black line you see should be below 0 degrees (c) through September and into October. However, these model forecast also use a “running mean” of several months, which in turn takes them longer to account for smaller changes in SST’s. The devil is in the details. Here are the last few weeks of “actual” SST’s for comparison purposes. Notice how the model above does not reflect the “actual” sea surface temperature departures in as much detail as the raw weekly numbers indicate below (Oct 9th data shows -0.7c, -0.3c, -0.3c and 0.0c.) Click on the image for a larger view —
Is this significant? Possibly, depending on how the forecaster interprets the current data and recent trends. In my view, past trends are important to long lead forecasting as we move forward. Others may disagree. I think we are likely to see the solid black line on the above plume forecast come down over the next few weeks as it corrects itself for the past few weeks worth of cooler than normal sea surface temps in the tropics. Bottom line = I believe models will shift away from any hint of an El Nino or even a warm side of neutral event going into the winter months. NOAA/NCEP forecasts have a good grip on this and their forecasts reflect it.
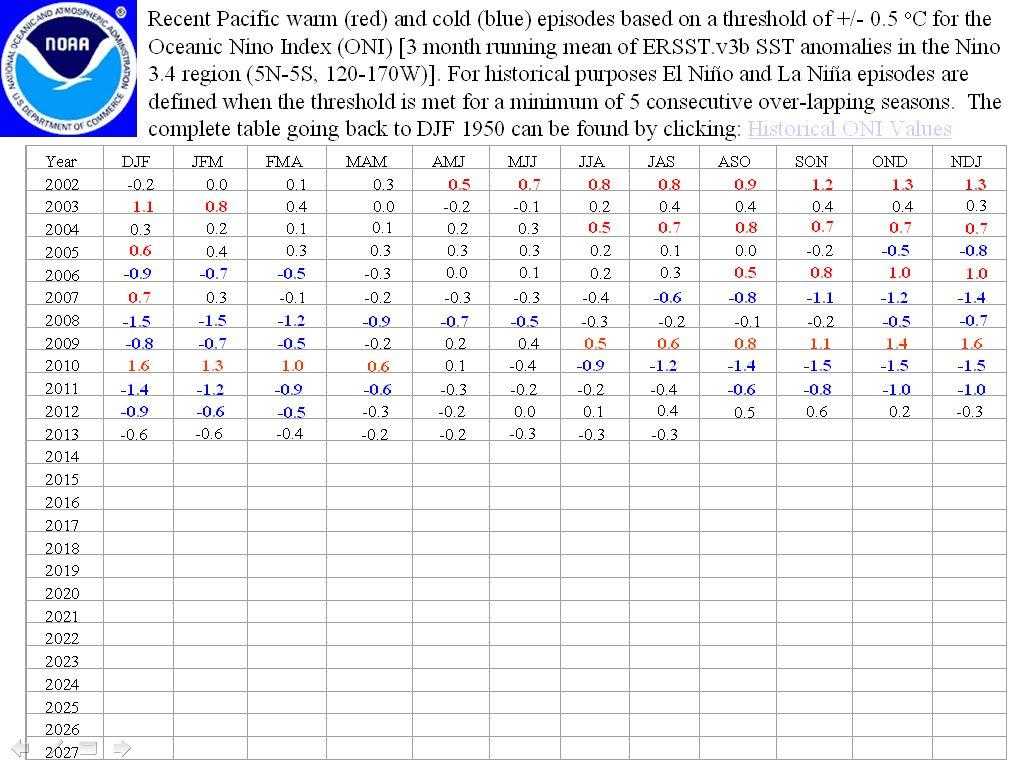
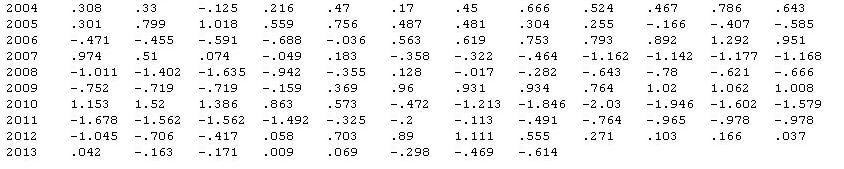
One of the other indices I look at is the ONI (Oceanic Nino Index) which takes into consideration the average sea surface temps across a particular region of the tropical Pacific Ocean. It is calculated on a three month running mean. Again, this is consistent with the idea that we are solidly in a “neutral” pattern or slightly cooler than average across the tropics. We sometimes call this La Nada! In other words, the absence of both El Nino and La Nina. You can also see similar years from the past. Click on the image for a larger view —
Next, I look at the PDO (Pacific Decadal Oscillation) which is an index that takes into consideration sea surface temps in the northern Pacific Ocean and Gulf of Alaska. This index has been shown to fluctuate on a 20-30 year cycle and last entered a cold phase in 2007 (some say it was 1998). Either way, it is clearly in a negative (cold) cycle now. In the negative (cold) PDO phase, the Pacific Northwest (on average) can see cooler than normal and wetter than normal weather. It is important to note that individual winters can vary from this long term “20-30 year average.” Simply put, the PDO phase can have an impact on where ridges and troughs set up in Pacific, which can have an impact on Pacific Northwest winter weather either one way or the other. Average snowfall in the Portland / Vancouver metro area is higher on average during the cold phase of the PDO vs. that of the warm phase, which we saw during the period from 1977-2006. Please note my use of the term “average.” Click on the image for a larger view —
Next we have the the MEI (Multivariate ENSO Index) which comprises several oceanic and atmospheric indices in order to derive and standard deviation from normal. The latest MEI number (-0.6) is consistent with a neutral pattern across the Pacific ocean. Click on the image for a larger view —
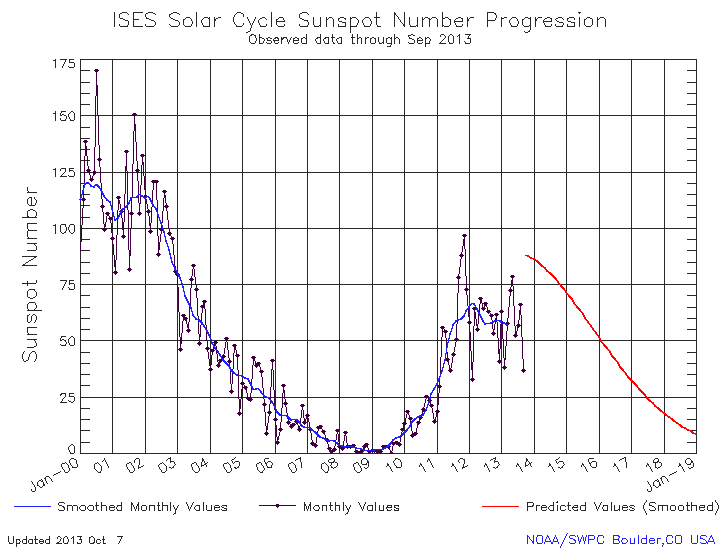
Finally, I look at the current solar output from the sun. As many scientists know, the sun went into a deep sleep in 2008 and has lagged below forecast output levels ever since. In fact, the current solar cycle is the weakest in 100 years. Some long range solar models suggest the next solar cycle (11 yrs from peak to peak) will be even lower than the current cycle. As you can see below, the suns output is lower than forecast. The red line is the forecast solar output. The actual data continues to run below what was forecast and it now appears as though we have passed our “average” solar maximum for this cycle. Click on the image for a larger view —
The final part of my winter forecast process involves finding similar years (also known as analogs) and applying them with a certain degree of weight to each of these indices and deriving a cumulative analog list. I also take a look at other indices such as the QBO, MJO, NAO and AO but these indices are largely left out of what I consider my “top 5” major indices. Are these important? Yes! But I have found that my forecasts become less accurate when too many indices are used. I have my own set of indices that I believe have the greatest influence on Pacific Northwest winter weather. Other forecasters will use their own. My choices are purely preferential and based on historical accuracy, performance and reliability.
Here are my leading analog (similar) winters to the current and most recent trends in the above listed indices. I place a weight to each of the above indices. I normally keep this “weight” private. Some of the above indices have a greater reliability and impact on Pacific Northwest weather than others. The analogs below are listed in date order only. My forecasts also adhere to a belief that weather is cyclical in nature and bound to repeat itself, as history has demonstrated —
1959-60
1962/63
1985/86
1990/91
2001/02
2008/09
In the set of analogs above, a trend begins to emerge. Here are some of the more interesting and notable events of these analogs —
1959/60 – January arctic blast & 11″ of snow in Portland. 13″ of seasonal snow in Portland. Below average winter precipitation overall. Below average winter temperatures overall.
1962/63 – Major wind storm in October 12th then 5″ of snow in Portland in January. Below average winter precipitation overall. Slightly above average winter temperatures overall.
1985/86 – Arctic blast and snow in late November then 7″ of Portland snow in December and February. Below average winter precipitation overall. Below average winter temperatures overall. Well below in November and December.
1990/91 – Arctic blast in December with high temps in the teens in Portland. Side note — Dec 1990 was the last time PDX saw a high below 20 degrees. Below average winter precipitation overall. Slightly below average winter temperatures overall, however very cold December and January.
2001/02 – A warmer than normal winter! No snowfall in Portland! Average winter precipitation overall. Slightly above average winter temperatures overall.
2008/09 -Major snow event December 20th-26th then 24″ of Portland snow for the season (19″ in December alone). Below average winter precipitation overall. Near average winter temperatures overall. Coldest December since 1990.
The next few leading analogs that did NOT make the top list were the winters of 1966/67, 1979/80, 1995/96 and 2003/04. Of these, 1979/80, 1995/96 and 2003/04 all saw 9″ to 13″ of seasonal snow in Portland including the record setting snow storms of Jan 7th-10th 1980 and ice storm of Jan 5th-7th 2004. The winter of 1966/67 was uneventful, as was 2001/02 noted above.
SO, WHAT IS MY BOTTOM LINE FORECAST FOR THIS COMING WINTER (2013/14) FOR NW OREGON, SW WASHINGTON & THE NORTHERN OREGON CASCADE SKI RESORTS?

BOTTOM LINE — Anything goes this winter! All cards are on the table! However, when averaged out we will see near normal temperatures, near normal precipitation and near normal snowfall. But the devil is clearly in the details! See below…
Headline #1 — Expect the increased potential for large variations in month-to-month weather as evidenced recently (Sept vs. Oct). The absence of either El Nino or La Nina increases the chances for record setting short duration weather events such as what we saw in September with record setting rainfalls. However, when averaged out across the entire winter (Nov-Mar) this winter will be about average in the categories of temperature, precipitation and snowfall. It is interesting to note that people tend to remember the singular extreme events more so than the overall winter average.
Headline #2 — There is an increased probability of one significant cold spell / snowfall event in Portland, likely between mid-December and mid-January and evidenced in the analog years listed above. Average snowfall in Portland over the past 100 years is about 6″. In the past 50 years that figure has dropped off to about 3-4″ on average. I am forecasting an “average” snowfall winter in Portland. It is important to note that extreme snowfall events in Portland have declined significantly over the past 50 years. However, there is also a trend of seeing several winters with NO snowfall in Portland followed by a singular year with a good shot of snow, followed by several more years with nothing. Having said that, the last significant snowfall winter in Portland was December 2008 which is an analog to this year. A “La Nada” winter increases the odds of picking up near normal snowfall in Portland. In several of the analogs there was as much as 2x the normal snowfall in Portland.
Headline #3 — There is an increased probability of a regional wind storm this winter. These are extremely hard to forecast at lead times greater than about five-seven days. The last significant “regional” windstorm was December 12th 1995 and December 14th 2006 to a lesser degree over Oregon. We are NOT guaranteed to see one of these. The analogs simply suggest a greater than normal probability.
Headline #4 — At least one of the upcoming winter months has a greater than normal probability to be quite a bit warmer and wetter than average. This could very well come quickly on the heels of a significantly cooler and drier than normal month. This could set the stage for a potential flooding event. Yes, the old “pineapple express.”
SKI RESORTS — Ski resorts will likely open up on their usual / average dates. Expect average snowfall at the local resorts when all the numbers are tallied up at the end of the season.
THE WILD CARD — If ocean surface temps in the tropics warm significantly (NOT currently forecast to do so) then we could see a drier than normal second half of the winter (January onward), with the increased probability of a prolonged ridge axis over the west coast. Again, this is NOT currently forecast, but it has occurred in the past.
Do you want to attend a free winter weather forecast conference and hear what other meteorologists predict for the upcoming winter?
The Oregon Chapter of the American Meteorological Society (AMS) will host the 21st annual Winter Weather Forecast Conference next Saturday, October 26th 2013 beginning at 10am at OMSI in Portland. This annual meeting is the single largest conference of its kind in the Pacific Northwest! Weather forecasters from across the region will once again converge on Portland to give their best prognostications for what this upcoming winter will bring weather-wise to Oregon and SW Washington. This meeting is also free and open to all ages of the general public. Please arrive early if you want a seat. We will also raffle off a $300 Davis home weather station to one lucky winner. This meeting normally attracts a capacity of 300+ attendees. To view complete details on this meeting please see: http://ametsoc.org/chapters/oregon
Stay tuned!
Steve Pierce
President, Oregon Chapter of the American Meteorological Society (AMS)
Columbian Newspaper Weather Blogger
Don’t forget — you can get my latest weather and climate updates via Facebook. Send me a friend request at http://facebook.com/stevepiercevancouver and I will add you in. Don’t forget to also bookmark this blog at http://blogs.columbian.com/weather. Are you an amateur simply interested in weather? Maybe you are a professional meteorologist? Why not join the single largest chapter of the American Meteorological Society (AMS) in the country with 180 fellow members? The Oregon chapter hosts eight monthly meetings from September through June. All of these meetings are free and open to the public. We are always looking for new members. Dues are just $10 a year! For Oregon AMS meeting details and a membership application, please see http://ametsoc.org/chapters/oregon
Steve Pierce
Steve Pierce is widely known as Oregon and Washington's "go-to-guy" when it comes to fast, accurate historical meteorological research and forecasts. Steve is currently the President of the Oregon Chapter of the American Meteorological Society (AMS). Steve is also recognized as a regional weather commentator and blogger who can be heard on local radio stations and seen in print media outlets across the Pacific Northwest. His Weather Blog is hosted by the Columbian Newspaper in Vancouver. Check it out! He is a third generation resident of Vancouver, Washington and holds a degree in Communications. Both sets of Steve's grandparents migrated to Vancouver during World War II. One set traveled from Lenox, Iowa to work in the Kaiser Shipyards supporting the war effort. The other set came to Vancouver from Olympia, Washington to work as educators for the rapidly expanding Vancouver School District. When the war was over, both sets of grandparents decided to stay in Vancouver and continue raising their families, as did thousands of other families at the time. Those who are most familiar with Steve can attest to the fact that weather is his true passion. His love for "all things weather" began at the age of 7 when Mt. St. Helens erupted in 1980. He was fascinated with which direction the ash plumes were headed. Then came the very powerful windstorm of Friday, November 13, 1981, also referred to as the "Friday the 13th" storm. This was the strongest storm to hit the Portland / Vancouver area since the great Columbus Day Storm of 1962! At age 11, he was asked to publish an extended weather forecast for his elementary school's weekly newsletter. In the 1980's, at age 14, Steve was the youngest of KGW-TV's local "weather watchers" and would phone in his daily Vancouver weather stats to then television meteorologist Jim Little for use on-air. Steve has lived through all of the major Pacific Northwest weather events of the past 30 years, and then some. The most notable events include; the bitterly cold winter of 1978-1979, the record setting snow storms of January 1980, the summer heat wave of August 1981, the windstorms of November 1981 and December 1995, the severe arctic blast of February 1989, the record flood of February 1996, the historic ice storm of January 2004, the Vancouver tornado of January 2008 and the record setting snow storm of Christmas 2008. Not to mention every Mt. St. Helens volcanic eruption in between. With access to the most extensive set of historical weather records available to date, Steve has personally designed and integrated a proprietary system that gives him the ability to quickly locate and manipulate weather data as far back as the 1800's. As one local Meteorologist put it, "Steve has fast access to historical weather data that is needed for media, agriculture, business, personal, historical and other climatological needs. He can quickly manipulate the data in many different ways. His forecasts are also quite accurate, especially at longer lead times." Steve also provides local storm assessments, narratives and weather presentations to the general public, as requested. In his spare time, Steve enjoys spending time with his family, the outdoors, vacationing at his family's coastal cabin and just relaxing! By the way, do you like your weather on the "extreme" side? So does Steve! Whether it is collecting damage assessment data & photos after record setting 125 mph winds at the coast in December 2007, being one of the first on the scene after the January 2008 Vancouver tornado, or feeling (literally) the awesome power of 100 mph wind gusts at Oregon's Crown Point in January 2010, Steve has experienced it all! As Steve says, "don't just love weather, live weather!" Check out Steve's personal weather website at: http://www.piercevideo.com/weather.shtml