
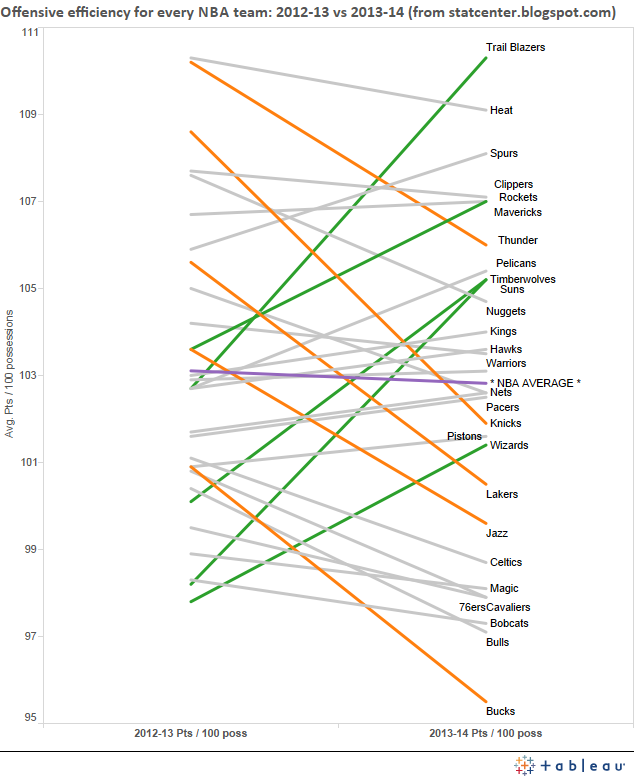
Chart visualizing the improvement of the Blazers offense


AP Photo/Don Ryan
While a lot of my time in this space has been dedicated to pointing out the Trail Blazers shortcomings on the defensive end, from time-to-time we must acknowledge the continued greatness of their offense.
Last season, they scored below the league average offensively but have risen to the top of the league in terms of offensive efficiency.
The website Statcenter posted a very cool chart that visualizes the rapid rise of the Blazers offense, as they’ve improved more than any other team in the league in terms of points scored per 100 possessions.
Here’s the chart via @statcenter
via Statcenter
To check out an analysis of why the Blazers have improved so much, read the rest here.
Erik Gundersen
Erik Gundersen is the Trail Blazers beat reporter for The Columbian. He's a graduate of the Allen School of Journalism and Communication at the University of Oregon in addition earning a degree in Spanish. He's covered the NBA for four seasons. You can also occasionally find his work on ESPN.com's NBA section for their TrueCities series. He also fist-bumped with Kanye West once. Follow @BlazerBanter on twitter for more Blazers and NBA news.